SOC 2 compliant • Low eBPF overhead • OpenTelemetry-native
Nothing found for ""

Mastering Node Affinity in Kubernetes
Master Kubernetes node affinity for optimal pod scheduling. Learn advanced techniques to enhance performance, resource utilization, and application reliability.

SIGKILL vs SIGTERM: A Developer's Guide to Process Termination
This guide will help you to understand the differences between SIGKILL and SIGTERM, as well as how they're used in environments like Linux, Docker, and Kubernetes

Understanding and Troubleshooting Out of Memory Error Code 137
This comprehensive guide will delve into the intricacies of error code 137, its common scenarios, and strategies to resolve it.

Mastering kubectl Scale Deployment: A Comprehensive Guide for Developers
Explore how to use kubectl to scale deployments up and down, scale all deployments in a namespace, managing replica sets, and more.

Navigating Kubernetes Contexts and Namespaces with kubectl
We all know that managing multiple Kubernetes clusters and their resources can be challenging. However, kubectl offers several context and namespace commands to simplify this process.
Announcement: StackState Acquisition by SUSE
StackState has been acquired by SUSE and will become the main observability engine in the Rancher platform.

Tips, Tricks, and Shortcuts for Navigating StackState
Unlock StackState's full potential! Our latest blog uncovers top shortcuts, hotkeys, and tips & tricks for seamless navigation & efficient issue resolution.

What is Application Performance Monitoring (APM)?
Learn what application performance monitoring and management are and how they differ. Discover how StackState's full-stack observability solution enhances the effectiveness of your APM systems.

Bringing ArchiMate Flow Diagrams to Life with End-to-End Observability
Discover the synergy of ArchiMate & StackState! Elevate architecture with real-time, end-to-end observability for seamless business alignment.

Orphaned Resources in Kubernetes: Detection, Impact, and Prevention Tips
Facing resource management challenges in your K8s environment? Discover strategies to detect and prevent orphaned resources with automated monitoring.

What Is the Impact of Digital Operational Resilience Act (DORA) on My IT?
See our CEO’s perspective on DORA's stringent regulations and how StackState's observability platform ensures compliance while optimizing efficiency and reliability.
ZenOps & StackState Partner for Kubernetes Observability Solution in France
This partnership will enable ZenOps to resell StackState's Kubernetes observability solution in France, and to provide first-level support, thus extending its portfolio of offerings around Cloud Native environments.

Kubernetes Monitoring: Best Practices and Essential Tools
Unlock efficient Kubernetes monitoring secrets for optimized app performance & issue troubleshooting. Explore 8 best practices & smart tool selection strategies.

Google Cloud Welcomes Full-Stack Observability with StackState
Now available on the Google Cloud Marketplace: a shared vision between Google and StackState, empowering businesses with cutting-edge observability.

360° Observability: Enhancing Reliability Across the Board
Need tips on talking to engineering about building better observability? Learn how to break down data silos, foster collaboration, and expand coverage beyond K8s.

Observability Unpacked: 5 Takeaways From KubeCon + CloudNativeCon 2024
Come explore the latest Kubernetes observability trends witnessed at KubeCon + CloudNativeCon 2024. See how the community is optimizing observability today.

Using eBPF to Debug eBPF
Uncover why StackState's eBPF probe fails on COS but not Ubuntu. Is it a kernel clash or a verification snag? See how we fixed the issue!

Take the Paris Observability Challenge at KubeCon + CloudNativeCon 2024
Join the Paris Observability Challenge at KubeCon + CloudNativeCon 2024! Take all 7 unique challenges, discover how StackState revolutionizes observability, and win some great prizes!

Application Troubleshooting with Automated Root Cause Analysis
Struggling with slow root cause analysis in your apps? Co-founder Mark Bakker shares how to speed up problem resolution and streamline operations.

How to detect and overcome Kubernetes CPU Throttling
Looking to maintain the stability and efficiency of Kubernetes apps. Learn to detect and conquer CPU throttling challenges in 11 simple steps with CEO Andreas Prins.

Streamlining Cloud Operations by Unifying Security & Observability
Elevate your cloud strategy by navigating challenges, empowering teams, and boosting efficiency with a unified approach to cloud security and observability.

eBPF: Revolutionizing Observability for DevOps and SRE Teams
Welcome to a new era of observability and troubleshooting. Discover the game-changing potential of eBPF for real-time insights into your systems.

The Last Mile of Observability — Fine-Tuning Notifications for More Timely Alerts
Learn all about the last mile of observability—fine-tuning notifications for timely alerts. It's all part of how notifications and incident tracking ensure quick resolution of IT issues.

Harmony in Chaos: Uniting Team Autonomy with End-to-End Observability for Business Success
Explore the challenges of decentralization, the critical contribution of end to end observability and the importance of frameworks like SLIs, SLOs, and SLAs.

6 Ways to Benefit from the SUSE StackState Integration
Discover the 6 key benefits of the SUSE and StackState integration for Kubernetes observability.

Multi-Cluster Observability Part 3: Practical Tips for Operational Success
Master multi-cluster observability with a seven-step approach and StackState's proprietary topology mapping, health monitors, remediation guides and alerts.

Multi-Cluster Observability Part 2: Developing The Right Strategy
In Kubernetes, a robust multi-cluster observability strategy is needed for unified views, consistent monitoring, scalability, data granularity and compliance.

Multi-Cluster Observability Part 1: Building A Foundation
Learn to manage multiple Kubernetes clusters for high availability, load balancing, scalability and more. Plus, discover the 5 common multi-cluster variations.
Mastering Kubernetes Node Management with the `kubectl cordon` Command
Learn how to improve Kubernetes node management with kubectl cordon and kubectl drain commands.

The Power of Data Correlation: Troubleshooting Made Easy
Learn how automating the collection and analyses of logs, metrics and events provides a quicker way for troubleshooting.

Configuration Drift: Understanding, Avoiding, Managing and Resolving in Kubernetes
Explore the concept of configuration drift and its significance in Kubernetes. Find out how to detect and manage configuration drift to ensure the stability and security of your system.

Application Dependency Maps: The Secret Weapon for Troubleshooting Kubernetes
Learn how Application Dependency Maps provide a real-time view of resource relationships, helping you quickly find and fix issues and collaborate more effectively.

Unlocking IT: Considerations for a Powerful Observability Strategy
Unlock the full potential of your observability strategy with our comprehensive guide. Learn how to go beyond metrics and dashboards to deliver superior customer experiences with StackState.

Platform Engineers: Applied Best Practices Are Baked-in to Kubernetes Monitoring
Learn all about StackState out-of-the-box monitors and how they can help you keep your Kubernetes clusters stable, scalable and maintainable.

Developer’s Guide on How to Troubleshoot HTTP 5XX Errors
In this blog post, read everything there is to know about troubleshooting HTTP 5xx errors and how using StackState alleviates a lot of your workload.
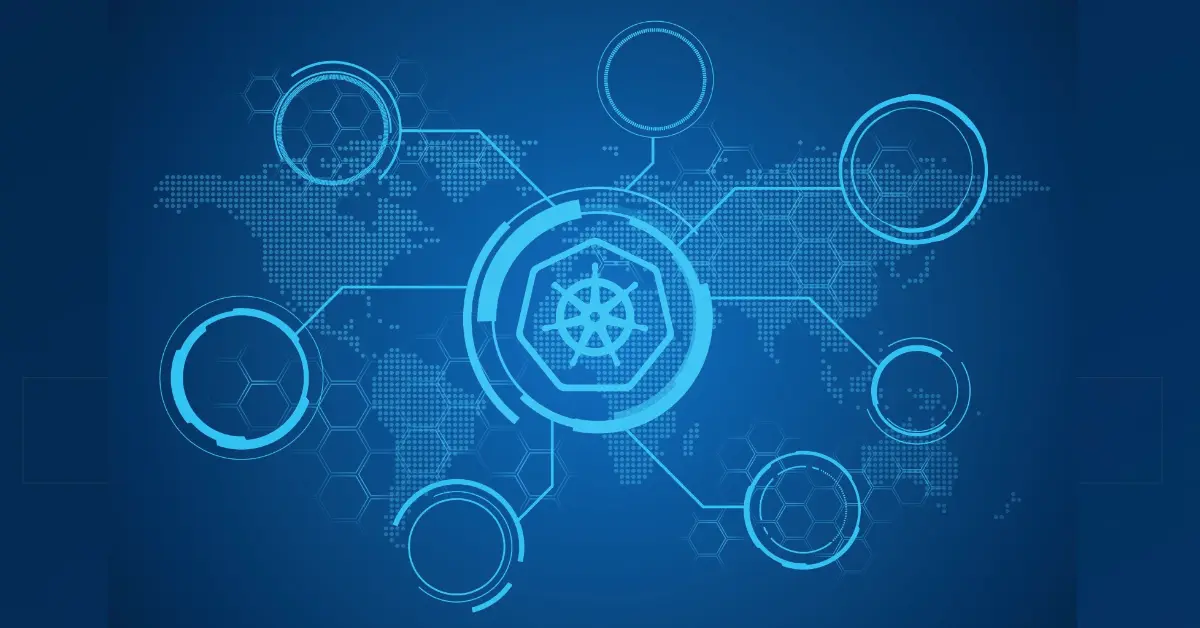
What Is a CrashLoopBackOff? And How to Fix IT
In this post, we'll dive into what CrashLoopBackOff actually is and the quickest way to fix it. Fasten your seat belts and get ready to ride.
Restarting Kubernetes Pods: A Detailed Guide
Learn how to restart Kubernetes pods, and how to troubleshoot issues that may occur.

From Battlefield to Business: Applying the OODA Loop
Discover the transformative power of the OODA Loop — Observe, Orient, Decide, Act — a military strategy adapted for software development.

Maximizing System Reliability: The Case for Dedicated Troubleshooting Tools
Unlock the potential of dedicated Kubernetes troubleshooting tools that empowers your engineers with comprehensive system views, precise issue identification and enhanced efficiency.

10 Burning Questions CTOs Have About Kubernetes
Gain insights from Gartner's report, "CTOs' Guide to Containers and Kubernetes," addressing key concerns, benefits, limitations and emerging trends.

A Chasm Crossed: The Unstoppable Surge of Kubernetes Adoption
Kubernetes can resemble a double-edged sword, capable of becoming either a dragon or treasure. Get advice, tools and tips for every stage of your Kubernetes journey.

Join us at Google's First Cloud Security Day in Copenhagen
Come join us at Copenhagen's first Cloud Security Day, hosted by Google, where we’ll be giving a talk on how you can elevate your cloud game through observability.

Kubernetes Architecture Part 3: Data Plane Components
This Kubernetes Architecture series describes the main components used in Kubernetes and introduces its architecture. Part 3 talks about components in the data plane.

Kubernetes Architecture Part 2: Control Plane Components
This blog is Part 2 of the Kubernetes Architecture series. Read this blog to build a deeper understanding of the Kubernetes control plane, which constitutes the central nervous system of a Kubernetes cluster.

Kubernetes Architecture Part 1: Reasons to Choose Kubernetes
This Kubernetes Architecture series covers the main components used in Kubernetes and provides an introduction to Kubernetes architecture.

Dependency Maps and Real-Time Topology
This blog dives into one of StackState’s most unique features, Kubernetes dependency maps. Dependency maps are Kubernetes service and infrastructure maps, enhanced with real-time topology, that show dependencies between all components.

Feature Spotlight: Kubernetes Remediation Guides Make Everyone Effective in Troubleshooting
Discover how StackState's remediation guides simplify Kubernetes troubleshooting by directing the user step by step through the process to find and remediate the issue.

Feature Spotlight: Dynamic Kubernetes Observability Dashboards
Discover how StackState's dynamic Kubernetes observability dashboards simplify troubleshooting by unifying essential data, streamlining monitoring and improving efficiency of remediating issues.

How To Get the Most Out of KubeCon Amsterdam 2023: Tips From a Dutchman
Discover how to make the most of KubeCon Amsterdam 2023 with our top tips, including suggestions from a Dutchman on exploring the city.
A Kubernetes Observability Tool to Support SRE Best Practices
This blog describes the Kubernetes observability foundation StackState has built to support SRE best practices and enable rapid remediation of issues.

8 SRE Best Practices to Help You Troubleshoot Kubernetes
This blog shares 8 SRE best practices you can follow to improve the process of troubleshooting Kubernetes for everyone.

Why Is Kubernetes Troubleshooting So Hard?
This post outlines the key troubleshooting challenges SREs and developers face when they need to quickly remediate issues in applications running on Kubernetes.

Kubernetes Liveness Probes: A Practical Guide
Have you ever wondered how you optimize Kubernetes pod management with liveness probes? Find out all about it in this blog post.

How to Create and Manage Secrets in Kubernetes
Kubernetes Secrets are a built-in resource type that's used to store sensitive data. Let's learn how to create and manage them.

3 Key Questions to Ask Before Getting Started with Kubernetes
If you deploy microservices and manage them at scale, Kubernetes is hard to beat. But Kubernetes also brings complexity - here are some questions to ask in order to mitigate the complexity.

Observability Innovation Report 2023
StackState commissioned research on observability adoption. The findings, “Observability Innovation Report 2023,” provide compelling information for practitioners.
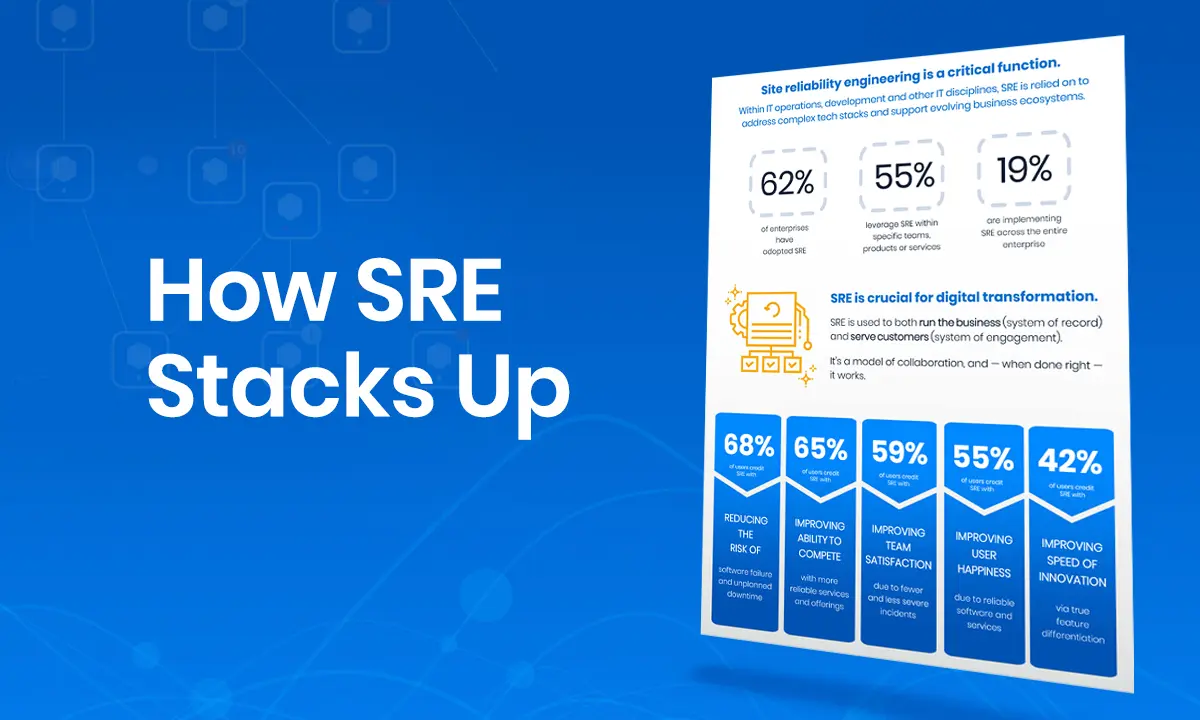
Infographic: How Site Reliability Engineering Stacks Up
Site reliability engineering (SRE) has the attention of IT - for good reason. In this infographic, we share findings from the "Global SRE Pulse" report.

Applying Lessons Learned from Baking Pizza to Kubernetes Observability
Baking a delicious pizza requires skill, experience and the right tools. The same is true for achieving optimal observability in a Kubernetes environment.
Guided Kubernetes Troubleshooting: How To Reduce Toil for Dev Teams
Troubleshooting Kubernetes issues fast is of great importance to provide a positive customer experience with your service. Here's how to do it quickly and easily.

How to Troubleshoot Slow Services in Your Kubernetes Cluster
To get the best performance out of a Kubernetes cluster, SREs and software engineers must have the knowledge and tools to find misconfigurations and bottlenecks.

Kubernetes Monitoring: 4 Data Types to Increase Insights
Data sources used to monitor a Kubernetes cluster include metrics, logs, events and traces, and component relations. Combining this data provides a comprehensive view of your Kubernetes cluster and can help you optimize resources.
5 Ways to Ensure Success With Your Kubernetes Platform
Success with Kubernetes requires you to pay attention to five key areas: SRE support, automation, observability, compliance and Kubernetes platform choice.

5 Predictions for Kubernetes in 2023
StackState presents five predictions for 2023 to pay attention to, in order to foster healthy growth and enable Kubernetes to flourish in your organization.

Applying OpenTelemetry for Deeper Observability
OpenTelemetry is an open source framework for APM and observability platforms. It provides portable telemetry for apps written in various programming languages.
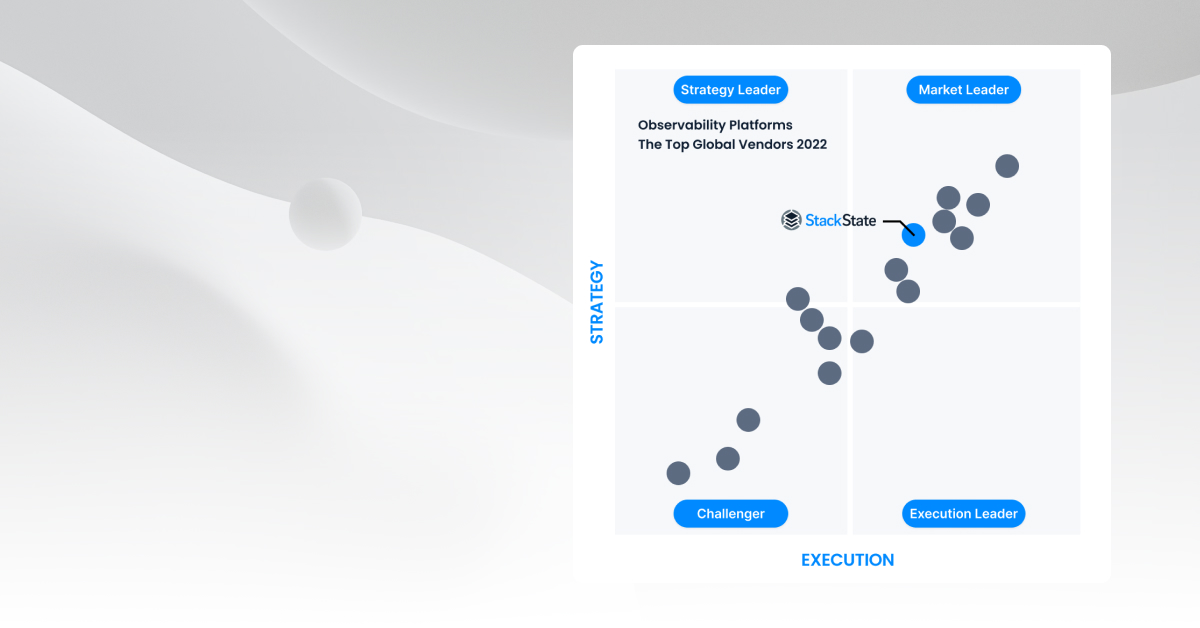
StackState Named Market Leader by Research in Action
The 2022 Vendor Selection Matrix™ from RIA is a useful guide for learning about observability market trends and top observability vendors and platforms.

MTTD: An In-Depth Overview About What It Is and How to Improve It
Get an in-depth overview about the incident metric Mean Time to Detect (MTTD), how to measure it, its relationship with MTTR, and how you can improve it.
StackState Observability Platform v5.1: Context Is King
Having the right information from your observability platform to understand the behavior of your stack is fundamental for solving problems. StackState Observability Platform v5.1 provides even deeper insights for managing your IT stack.

Improve Application Reliability With 4T Monitors
StackState’s new 4T® Monitors introduce the ability to monitor IT topology as it changes over time to enrich observability data and improve application reliability.

Automate Troubleshooting of Applications Running on Kubernetes
Observe your entire Kubernetes stack with StackState to automatically identify problems and highlight the changes that caused them for full context observability.

What is an Anomaly? And How to Detect Them
Learn what an anomaly is, strategies to detect them, and why a proactive approach is becoming more important in today's complex and dynamic IT environments.
IT Monitoring: An Introductory Guide With 5 Monitoring Strategies
Get a better understanding of monitoring and learn five monitoring strategies and best practices to advance your monitoring to full stack observability.

Understanding Domain-Agnostic v. Domain-Centric AIOps Platforms
Understand the pros and cons of both domain-agnostic and domain-centric AIOps platforms so you can choose the approach that best suits your company’s needs.
The Complex But Elegant Relationship Between AIOps and Observability
Find out how an efficient observability platform powered by AI empowers digital transformation and eliminates complications caused by change and complexity.
Part 6: Observability Maturity Model Summary
This final blog of our 6 blog series provides a summary of each level of the Observability Maturity Model and how StackState can help you move to the next level.
Part 5: Proactive Observability With AIOps – Level 4
Learn about proactive observability with AIOps in part 5 of our 6 blog series that outlines the basics of the Observability Maturity Model.
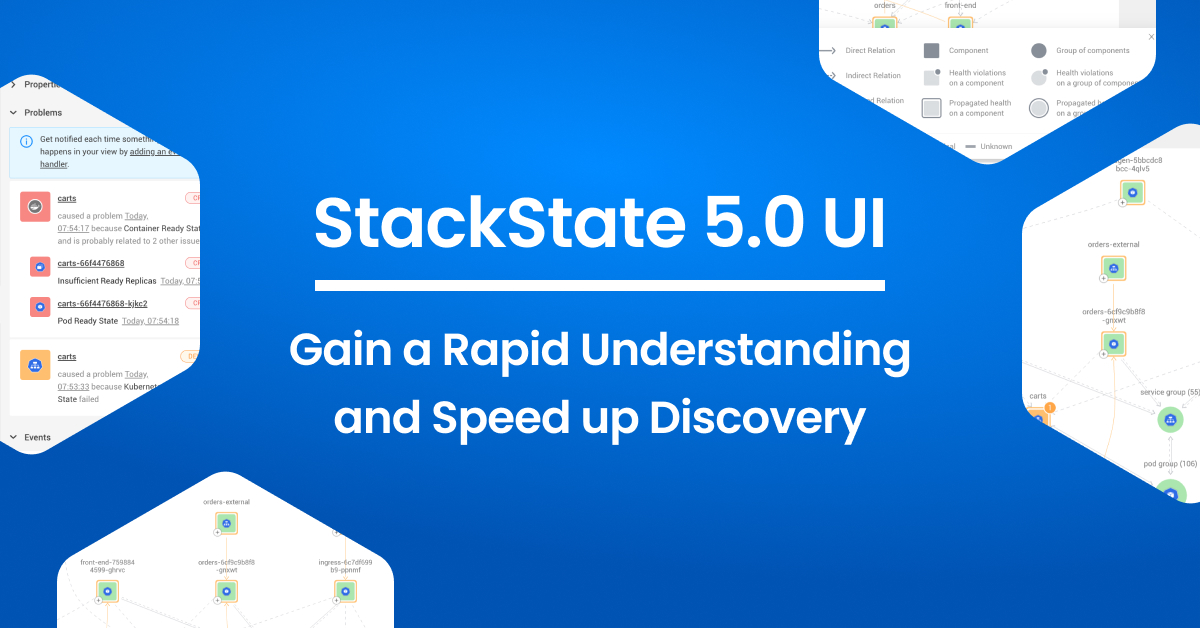
StackState 5.0 UI: Gain a Rapid Understanding and Speed Up Discovery
Find out how our v5.0 UI release is a big step forward in supporting you on your journey of easily discovering the right information to resolve incidents quickly.

Part 4: Causal Observability – Level 3
Learn about casual observability and the additional dimensions of topology and time correlated with telemetry data, and the impact of any incident or change.
AIOps for Real: Characteristics of a Platform That Add Value and Drive Change
Explore the characteristics of a real AIOps Platform and dive into Gartner's criteria that add value and drive change, so you can choose the right AIOps solution.
Part 3: Observability - Level 2
Part 3 of a 6-part series about the Observability Maturity Model that describes how observability naturally evolved from monitoring as reliability demands grew.
Part 2: Monitoring – Level 1
Learn why monitoring is the foundation for observability, providing basic insights and warnings into the health and status of individual IT components.

Changes are Observability’s Biggest Blind Spot
Discover why the ability to track changes over time, at any point in time, and then correlate it with incidents when they occur is crucial to observability success.
Part 1: An Introduction to the Observability Maturity Model
A series of six blogs outlining the 4 pillars of the Observability Maturity Model, starting with and introduction to help you identify where you are in the model.
Real World Insights - My Take on the Observability Maturity Model
StackState's co-founder and CTO, Lodewijk Bogaards, explains how to use the recently published Observability Maturity Model on your observability journey.

Intelligent Alerting and Root Cause Analysis
Speed up root cause analysis with anomaly detection that sets up intelligent alerts to eliminate information overload and proactively prevent problems.
Site Reliability Engineering, Site Reliability Engineers and SRE Practices: State of Adoption
Read highlights from the 2022 Global SRE Pulse Report. Read about the role of site reliability engineers, site reliability engineering practices, state of adoption.
AIOps: Hype vs. Reality
Find out what AIOps is, what's hype vs. reality, and how five essential characteristics of an AIOps platform can help your observability practice.

StackPod: Jujhar Singh of Thoughtworks on Why Technology Is Always About People
We're thrilled to share that Jujhar Singh, lead consultant at Thoughtworks, was a guest in our podcast! Here's what Jujhar and Anthony talked about.

SOC 2: Data Security for Cloud-Based Observability
StackState has achieved SOC 2, SOC 3 compliance! By gaining this globally-recognized certification, you can rest assured that we are looking after your data.
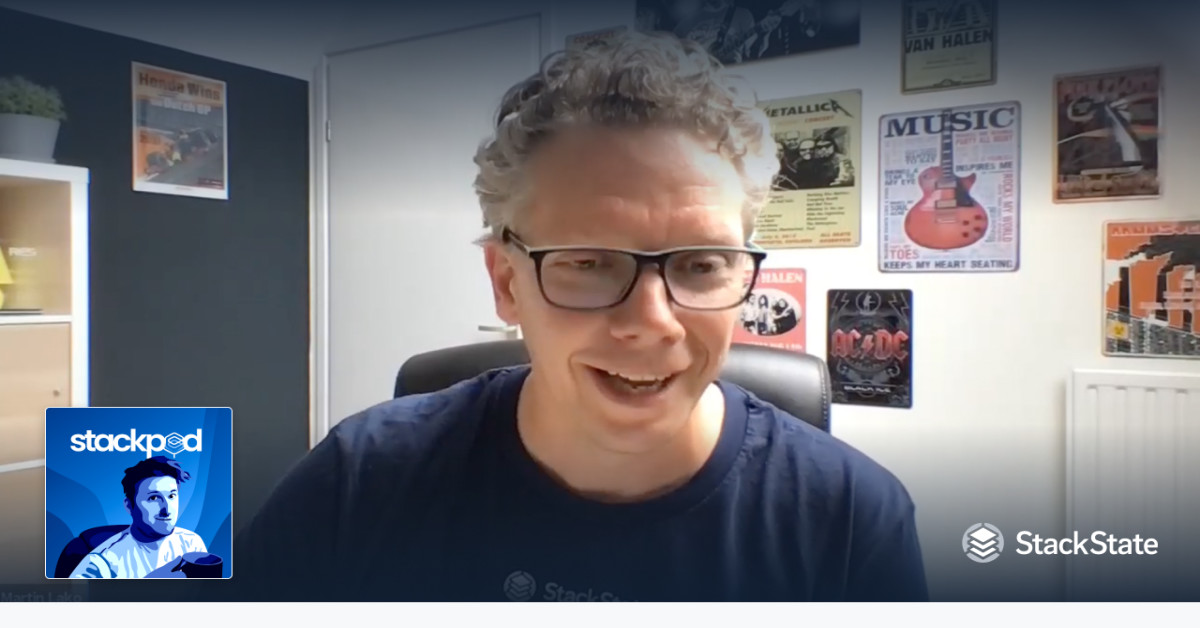
StackPod: Making Customers Successful With Martin Lako of StackState
We published a new StackPod episode! This time, we invited StackState Director of Customer Success, Martin Lako. Here's what it is all about.

A Data Lake Is Not Enough to Keep Your Observability Ambitions Afloat
Find out why a data lake alone does not provide the depth of observability you really need to maintain reliable and resilient IT systems in today's complex world.

What You Need to Know in the Upskilling IT Global Report
As a gold sponsor for DevOps Institute’s fourth annual Upskilling IT report, we compiled some key takeaways. However, there is so much more to get from this report – so download and read the full report.
StackState’s v5.0 Release Delivers New 4T Monitors and More: Apply the Power of Topology to Transform Traditional IT Monitoring
Checkout the v5.0 release of StackState's observability and AIOps platform! Including new 4T® Monitors, an enhanced Topology Visualizer, a new CLI, and much more.
Big Relationships Grow From Big Data: UMBRiO, StackState and Splunk
Seven years ago, I was focused on big data. Little did I know that focusing on big data would lead to big relationships. The long-standing relationship I have had with UMBRiO now extends across StackState.

StackPod: Dotan Horovits on Why Observability Is a Data Analytics Problem
Dotan Horovits, blogger and developer advocate at Logz.io, shares why observability is not just the sum of logs, metrics, and traces but is a data analytics problem.
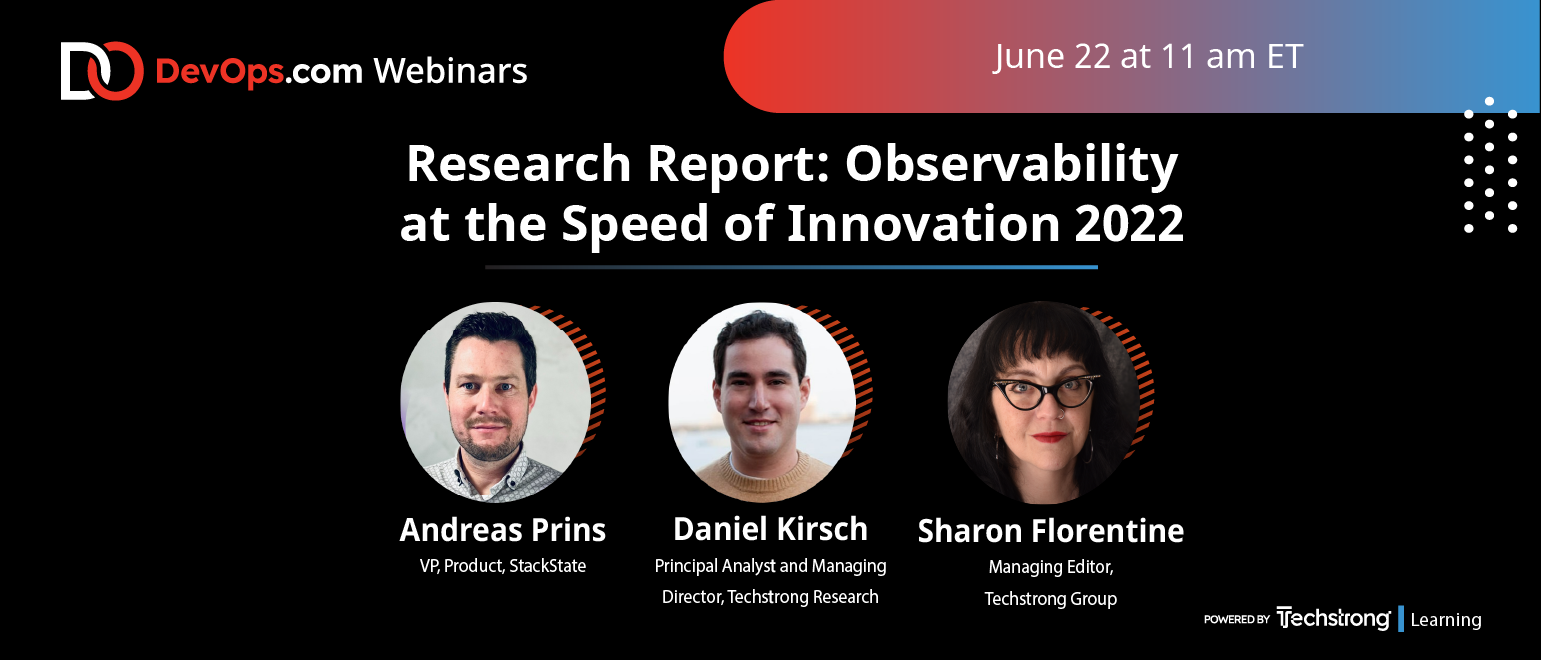
Research Findings: Observability at the Speed of Innovation 2022
StackState has partnered with Techstrong Research to research the current state of observability. Find out why the adoption of observability will grow by 20% by 2024.
Learn the Latest from "Research Roundup for Modernizing Infrastructure and Operations in a Hybrid World" by Gartner®
Learn the latest from the Gartner Research Roundup for Modernizing Infrastructure and Operations in a Hybrid World and five key focus areas you won’t want to miss.

New StackPod Episode: Defining and Executing a Clear Product Strategy With Andreas Prins
In our latest StackPod episode, we had a chat with Andreas Prins! Andreas is StackState's VP of product. He shares what it's like to be a product manager: how do you define a clear strategy and make sure everyone is on board?
Survey: Are You Using an Observability Solution, Implementing One, Actively Planning for It or Thinking About It?
Take TechStrong Research's “Observability at the Speed of Innovation 2022” survey, to better understand who is using observability and where they are in the process.

Observing Chaos: Is It Possible?
Learn the four ingredients necessary to achieve real-time visibility into dependencies to support chaos engineering and why observability is the foundation.

What Is Telemetry and Why Is It Important?
Find out what telemetry is and why the way its designed has a huge impact on IT observability, root cause analysis and how well you can relate changes to incidents.
6 Ways Topology-Powered Observability Gives Back Time to Your Organization
Find out how observability can make your data more actionable, so that you can boost productivity and free up time to focus on application development.

5 Takeaways From StackState Customer Reviews on G2
StackState CEO, Toffer Winslow, discusses the 5 key takeaways that are responsible for the great customer reviews they receive on technology review website G2.

New StackPod Episode: OpenTelemetry - the Future of Observability?
For our latest StackPod episode, we invited StackState senior engineer Melcom van Eeden to talk about OpenTelemetry: What is it and is it the future of observability?

Happy Customer Appreciation Day!
It's Customer Appreciation Day! We’d like to take the opportunity to thank all of our customers, not just for your business, but for how great you are to work with.
How to Use OpenTelemetry with StackState
Get an in-depth overview of how to use OpenTelemetry to troubleshoot a serverless environment using StackState for effective observability.

Win a Big Green Egg Grill at the ONUG Spring Conference (27 - 28 April)!
Are you joining ONUG’s Spring Conference 2022? Join our PoC to learn why topology-powered observability is a smoking hot topic and win a smoking hot Big Green Egg!
Gartner®: Where are Monitoring Tools Headed? Help from "Innovation Insight for Observability"
Explore our key takeaways on Gartner's “Innovation Insight for Observability." Learn why observability, as an evolution of monitoring, offers advanced insights.
New StackPod Episode: Implementing an SRE Practice with Yousef Sedky of Axiom/Hyke
For our latest episode, we invited Hyke’s DevOps team lead and AWS Cloud architect: Yousef Sedky. Yousef shares his insights and learning about his journey while building an infrastructure from scratch and implementing an SRE practice.
New StackPod Episode: Best Practices for AWS Observability With Russell Foster of StackState
We’re excited to share that we are celebrating our tenth podcast episode! For this episode, we invited Russell Foster. As a DevOps engineer at StackState, Russell is responsible for making sure our SaaS product runs smoothly on AWS.

Unified Serverless Observability With OpenTelemetry and StackState v4.6
Find out how StackState v4.6 enhances observability with support for OpenTelemetry traces, specifically for serverless AWS Lambda applications built with Node.js.
Introducing StackState 4.6: Harnessing the Power of Topology + Telemetry + Traces + Time
StackState is proud to announce v4.6, delivering new capabilities to DevOps and SRE teams who need to maintain a deep understanding of how their stack is behaving.
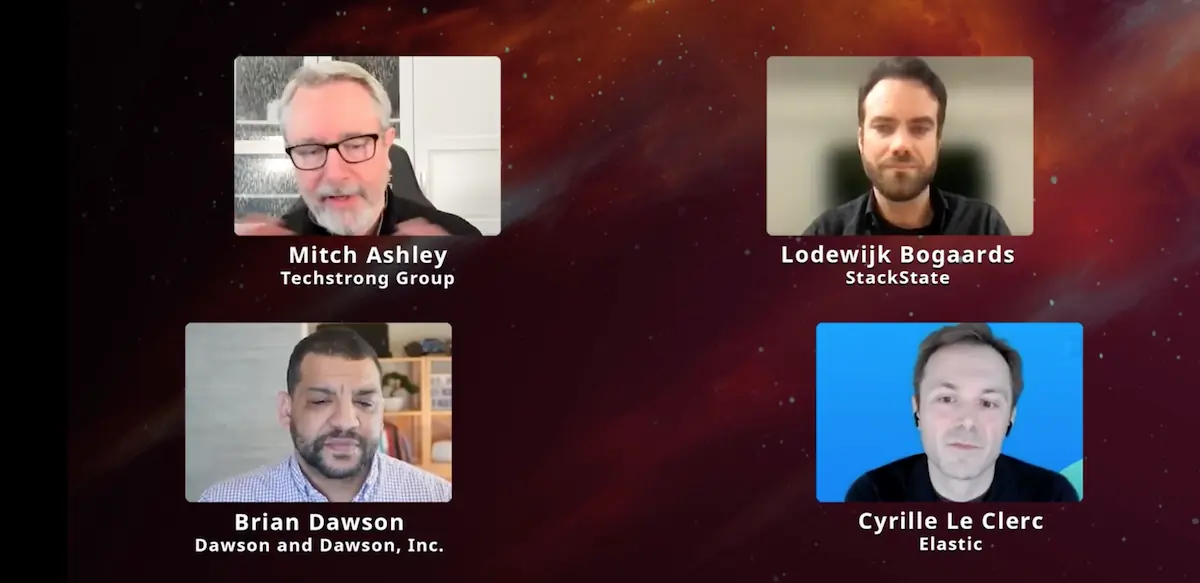
The Future of Observability, According to Experts
TechStrong CTO and cofounder Mitch Ashley sat down with Lodewijk Bogaards, Brian Dawson and Cyrille Le Clerc to discuss the present and future of observability.
Building Digital Platforms for Adaptive Resilience: Looking Inside Gartner® Predicts 2022
Find out what's next in tech from Gartner Predicts 2022: Building Digital Platforms for Adaptive Resilience.” A guide for I&O leaders with their sights on 2025.

Summary: 2021 Gartner® Market Guide for AIOps Platforms
StackState shares key takeaways from Gartner's 2021 Market Guide for AIOps Platforms and is named a Representative Vendor in the domain-agnostic AIOps platforms.
Infographic: The Shift to Observability. And Why It's Time.
See the evolution of monitoring and the data stack and find out why it's time to shift to observability and how it can can help in today's complex IT landscape.
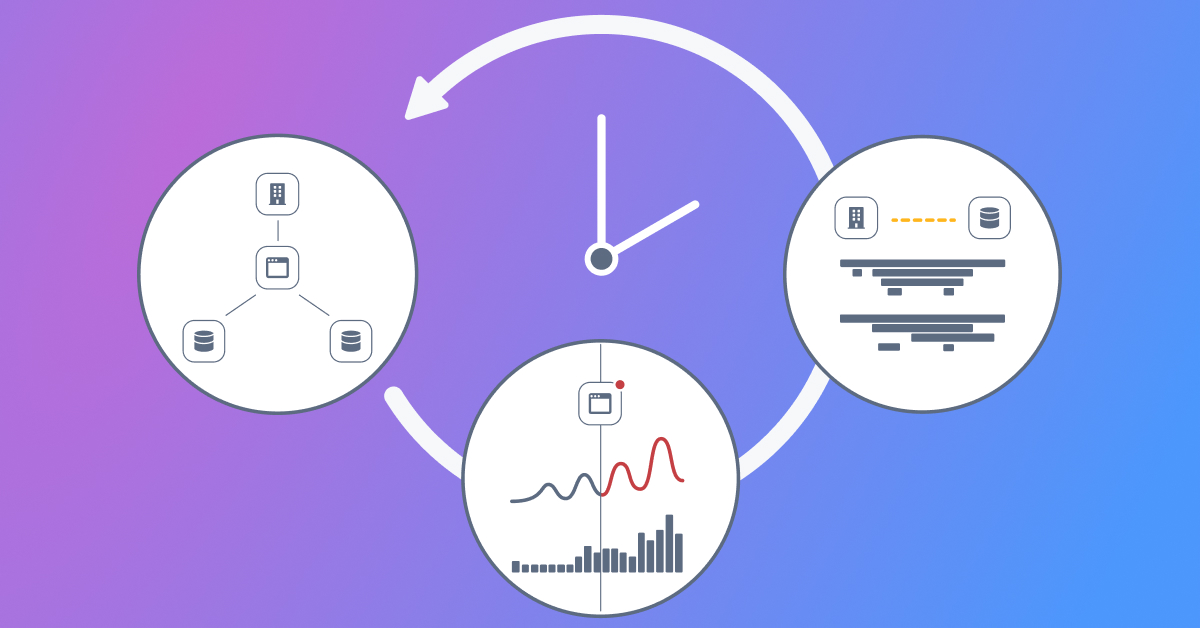
Infographic: Achieving True Observability With the 4 Ts
See how StackState’s 4T data model correlates topology, telemetry and traces at every moment in time, to deliver real-time contextual insights of your full IT stack.

Getting Actionable Insights from Massive Amounts of Observability Data
Learn the importance of contextualized observability data and why without it you will not be able to reduce alert storms and gain actionable insights.
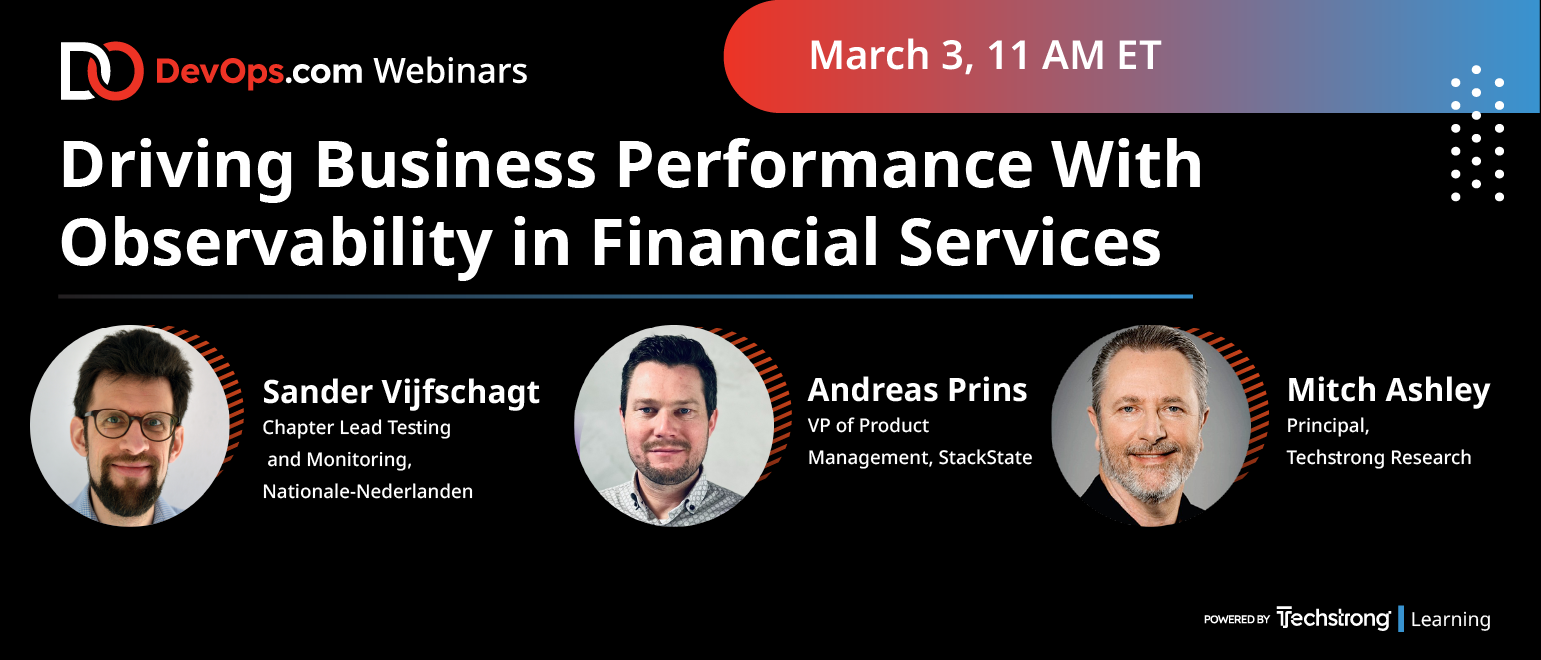
Observability in Financial Services: Nationale-Nederlanden Bank
Discover how Nationale-Nederlanden Bank improved reliability, eliminated silos and gained deep insights across a very complex and dynamic IT environment.

A CSI Approach With Topology-Powered Observability
Like an episode of CSI, your team needs to solve incidents quickly. Learn how to find the root cause quickly using StackState topology-powered observability.
Gartner IT IOCS Highlights: How Accenture Powers Automation Through Observability and StackState's 4T Data Model
At the recent Gartner IT IOCS conference, Accenture outlines how they power automation with StackState's 4T Data Model and their Observability and AIOps Platform.

3 Things You Don’t Want to Miss at Gartner’s I&O Conference 2021
Gartner’s 2021 IT Infrastructure, Operations & Cloud Strategies conference is right around the block. We've selected the three sessions you don't want to miss.
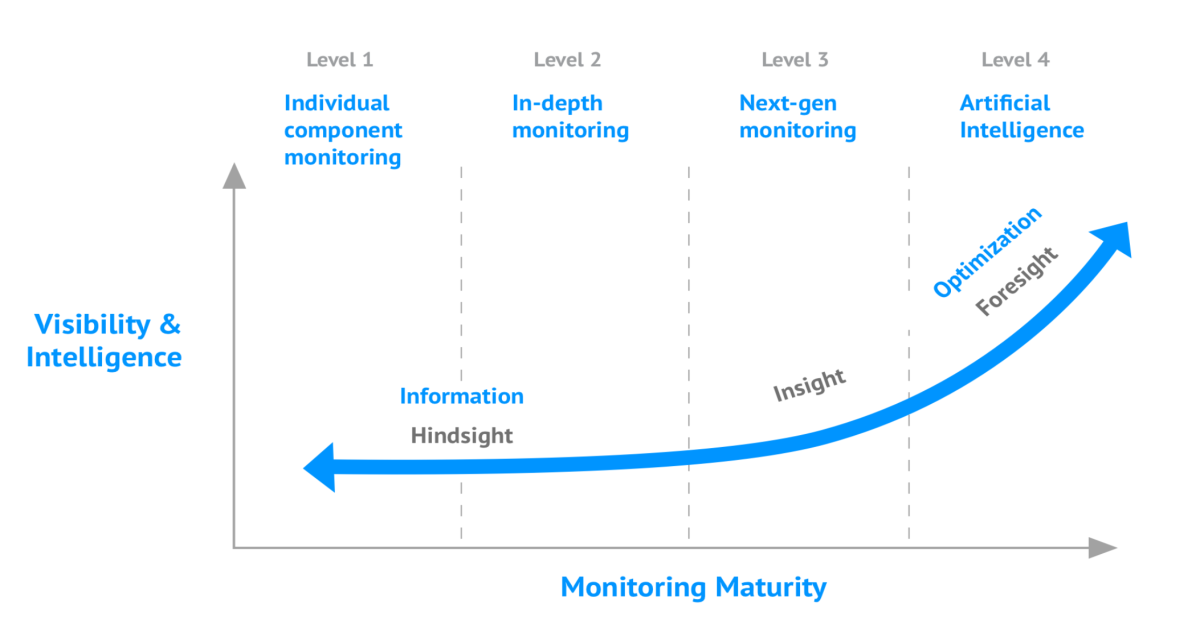
The Monitoring Maturity Model explained
Discover how mature your IT monitoring is, which stage of the Monitoring Maturity Model your company is at, and how to get a unified overview of your full IT stack.

How It All Began... - Stackstate’s Origin Story
Learn how Mark Bakker and Lodewijk Bogaards launched StackState, the first observability platform with a time-traveling topology, based on a custom graph database.
What We’re Most Psyched to See at Kubecon '21 and Enter to Win Free Tickets!
Good news: next week, we’re exhibiting at CNCF’s flagship conference Kubecon (both virtually and IRL) in the City of Angels. Want to join? Win free tickets and find out which sessions we're most psyched about.

Topology-Powered Observability Myths Debunked
Discover why topology-powered observability seems too good to be true and learn about the reality and functionality it provides that disproves the myths.

Elastic and StackState Team Up to Pull Needles Out of Haystacks
If you’re using Elastic Observability, you’ve seen the major advantage of bringing your monitoring data together into one unified view. Read on for a quick glimpse at how Elastic and StackState work together.

The Ultimate Guide To Telemetry
Learn everything you need to know about telemetry. Find out how telemetry data is collected, how it's used, and why it is important to Obeservability.
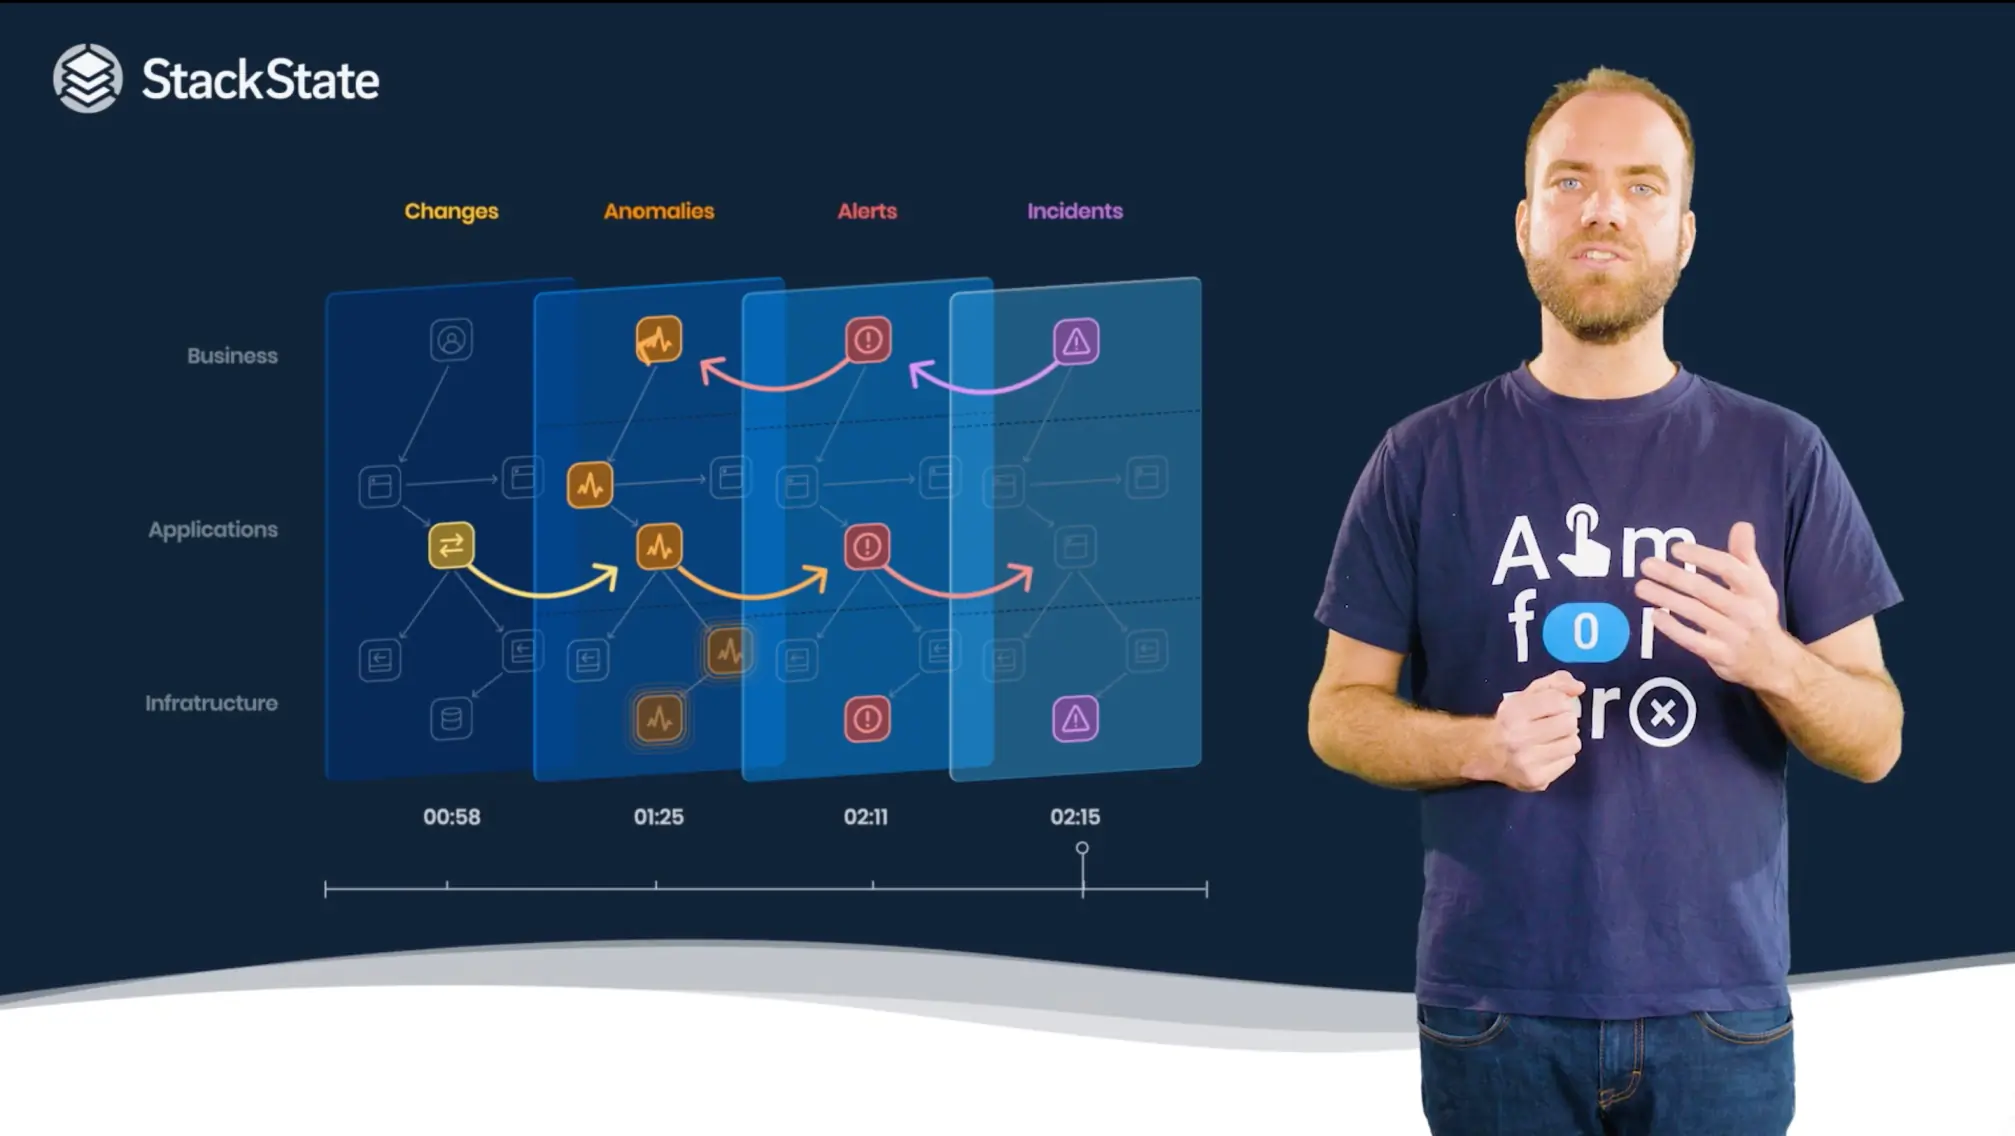
Our Vision of the Zero Downtime Enterprise
Lodewijk Bogaards, CTO and co-founder of StackState, explains our visions of the zero downtime enterprise and how we enable organizations to aim for zero.

Lightning Strikes Twice: Why I Joined StackState
We recently announced the appointment of our new CEO, Toffer Winslow. In this blog post, Toffer explains why he joined StackState and is looking forward to "lead a company with such potential".

Investigating the Scene of an Incident: Using a Time-Traveling Topology to Create Escalation Graphs
Discover why an escalation graph with time-traveling topology is essential for investigating and resolving IT problems from root cause to business impact.

Observability and the Monitoring Maturity Module
Organizations approach IT observability in different ways. Learn what the Monitoring Maturity Model is to find out if your company's observability infrastructure is adequate for your needs.

Why the Role of the CIO is Constantly Changing and Challenging
The role of the CIO is becoming more and more important. The scope of the role has changed massively though, and we are sure it will continue to do so. Let’s find out why.
MTTR vs MTTD: What Is the Difference?
Learn what Mean Time to Detect (MTTD) and Mean Time to Repair (MTTR) are, as well as their differences and how each metric is calculated to determine success.

Top Observability Strategies for Distributed Systems
Learn top tips for an observability strategy and how observability can empower your IT team and business. Discover how StackState can streamline your observability process.
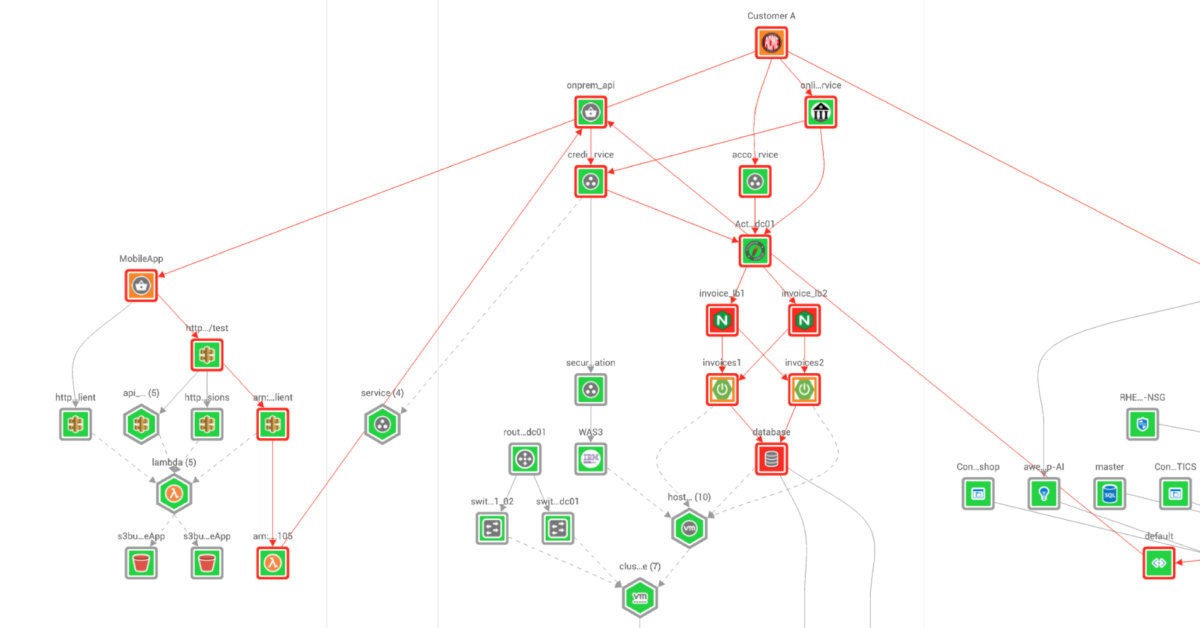
What Is Topology?
Learn what topology is and the challenges it brings and discover how StackState's topology-powered observability can provide real-time topology insights.
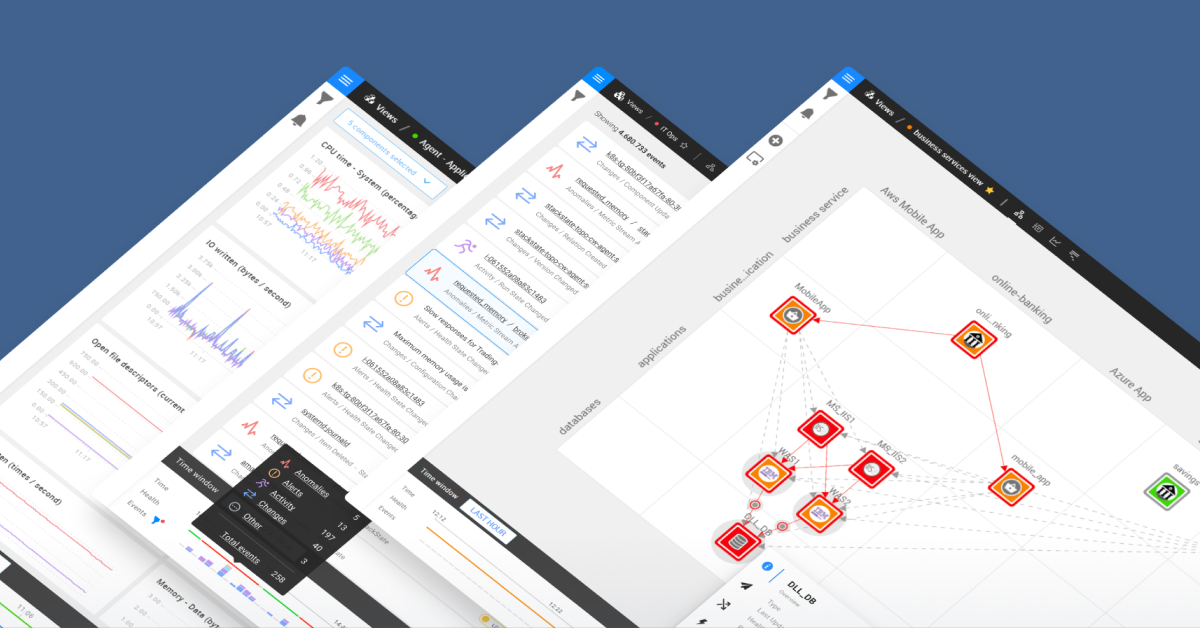
What Is Root Cause Analysis (RCA) and Why Do You Need It?
Find out what root cause analysis (RCA) is and why it is essential to identify IT incidents fast in order to fix them and prevent them from recurring.

Happy International Women’s Day from StackState
As we celebrate International Women’s Day, let us introduce you to the women of StackState.

What is Observability?
Learn what observability is, how it can benefit your IT team, and why it is key to ensuring the reliability and performance of your business applications.

Only Autonomous Anomaly Detection Scales
In this blog, Lodewijk - CTO at StackState - explains the difference between manual and autonomous AI and why only the later scales.
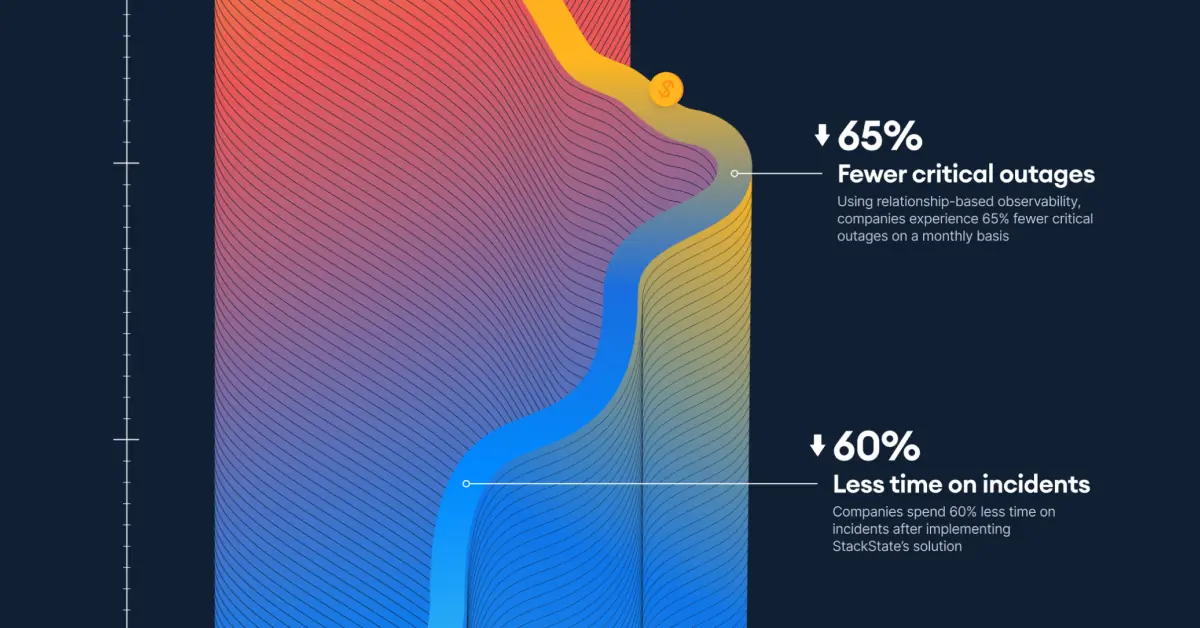
The True Cost of IT Failures (and What to Do Instead)
IT failures can be very expensive. Find out how much IT incidents cost and how much you can save by adopting a relationship-based observability platform.

Gartner's 2021 Strategic Roadmap for ITOps Monitoring highlights
In this blog, we'll show you some of the highlights of Gartner's 2021 Strategic Roadmap for ITOps Monitoring.
Removing the Chaos Between Monitoring and Incident Management
Find out how topology-powered observability solutions take the incident management process from chaotic to structured and speed up the incident resolution process.

What IT Monitoring and Incident Management May Be Missing
Is your IT environment highly monitored but incidents seem to slip through the cracks? Here’s how full-stack observability can help.

Innovation Insight for Observability by Gartner
Get a sneak peak of Gartner's 'Innovation Insight for Observability' report and learn why observability is the evolution of monitoring and its benefits.

Observability vs Monitoring
Explore how observability differs from monitoring and goes beyond metrics, logs, and traces, and also focus on the relationship between all IT components.
The Downsides of Predictive Monitoring
Learn why predictive monitoring is often not the best way to improve monitoring coverage, increase problem resolution, reduce alert fatigue, and save time and money.
The Business Case for Observability With Context
Learn how observability with context helps you understand the impact of a failure in relation to other elements of the stack and the business outcomes it supports.

When an IT Incident Occurs at Your Company, What TV Show Does It Most Resemble?
What approach does your organization take to IT incidents? We've likened popular approaches to favorite TV shows. Find out which one yours most resembles!

Observability With Context Telemetry, Time, Tracing and Topology
Jason Bloomberg explains how observability with context helps you resolve issues promptly and cost-effectively for each incident in real-time.

Automated Root Cause Analysis & Anomaly Detection in Concert
Read and learn how automated root cause analysis and anomaly detection can work in concert to reduce Mean Time To Repair (MTTR) as much as possible.
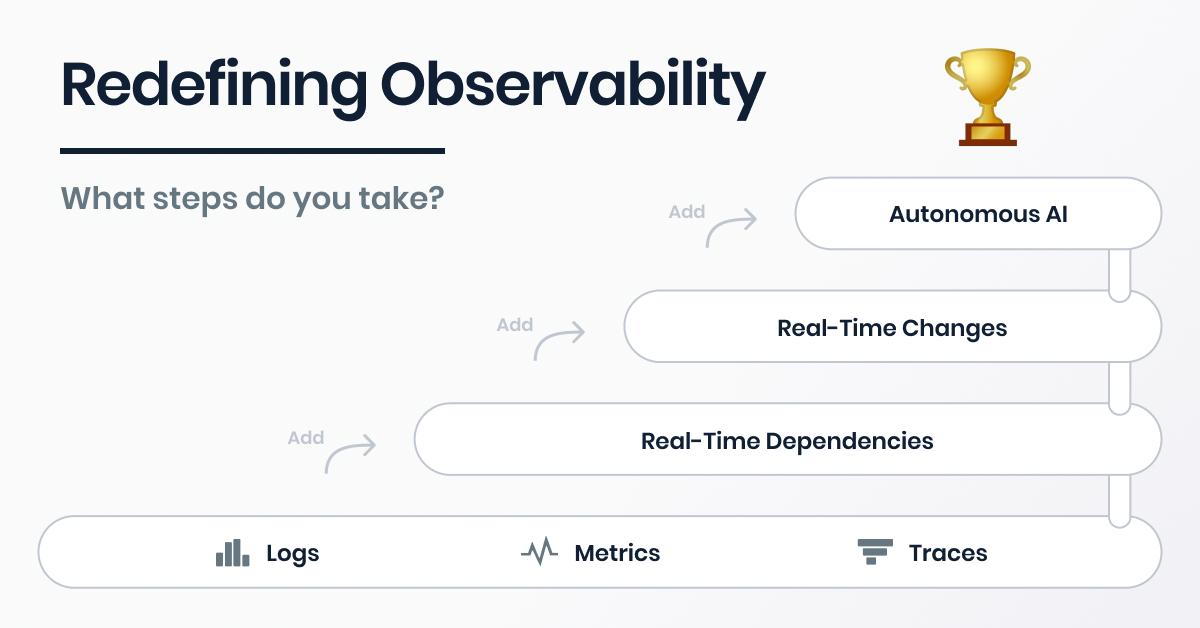
Observability Redefined: 3 Steps to Improve Your IT Infrastructure
Learn how real-time topology, tracking real-time changes and adding AI can help you redefine observability and gain back control of your fast-changing IT landscape.

StackState ❤️ Open Source
Learn why StackState is a big believer in open source software and how it helps us to build on top of well-tested code in use by millions of people, worldwide.
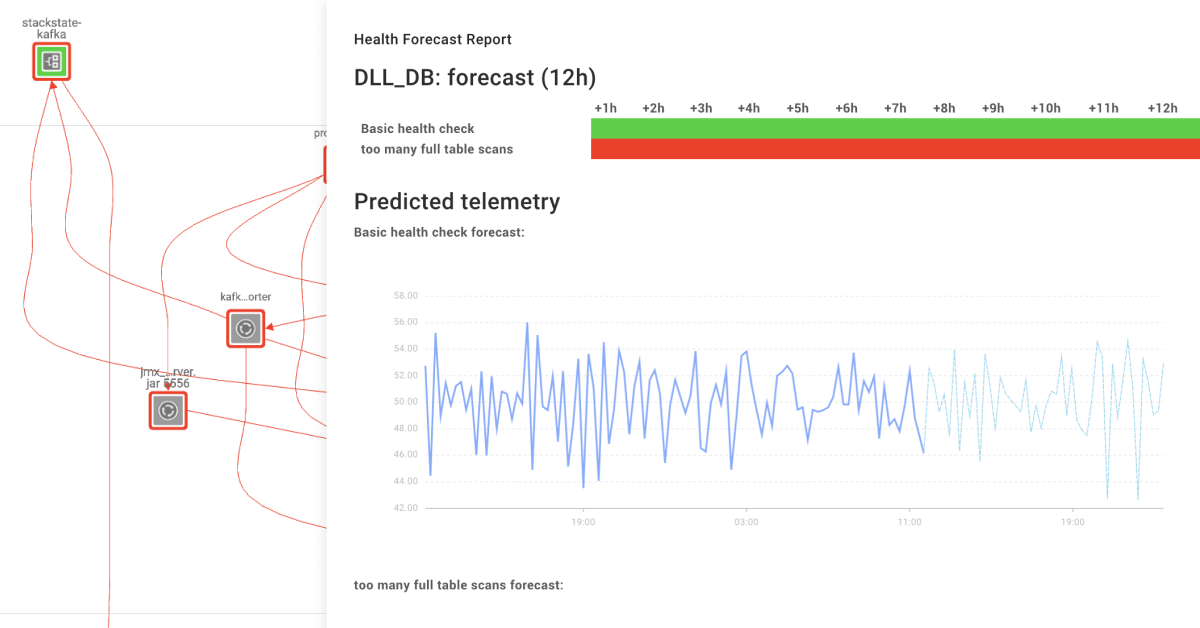
StackState's Health Forecasting
Forecasting the health of IT infrastructures is equally essential. That is why StackState introduces Health Forecast StackPack.

Self-Driving Anomaly Detection
StackState's Self-Driving Anomaly Detection is easy to configure and scales to large IT environments and runs on all data streams.

Three types of data for anomaly detection
It’s important to know that there are three types of data necessary for anomaly detection. In this blog post we’ll go through all three types.
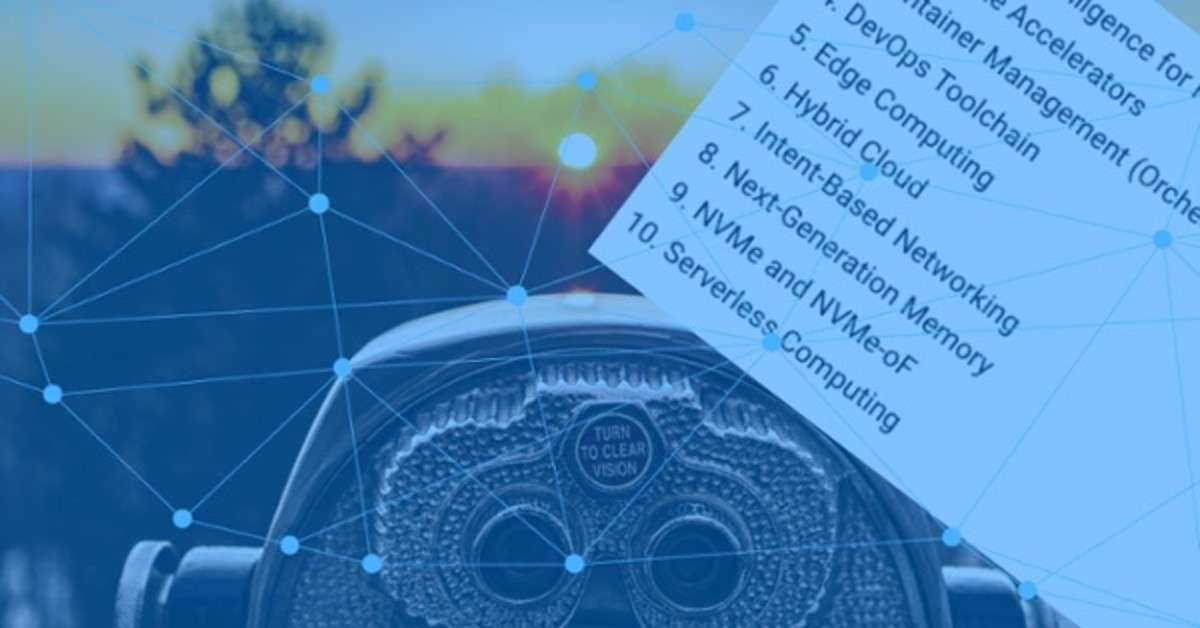
Top 10 I&O Technologies for a successful 2020, 2021, 2022, 2023 & 2024
Top 10 I&O Technologies for a successful 2020, 2021, 2022, 2023 & 2024. Learn where to focus on within Infrastructure & Operations.

How AIOps and CMDB can work in concert to manage IT changes
Gartner describes how I&O leaders can improve observability, customer experience and business health by using AIOps and CMDB in concert.

Designing a flexible NoSQL query language without reinventing the wheel
Why does StackState use StackState Query Language (STQL), instead of SQL? In this blog, Lodewijk shares StackState's approach to design STQL.
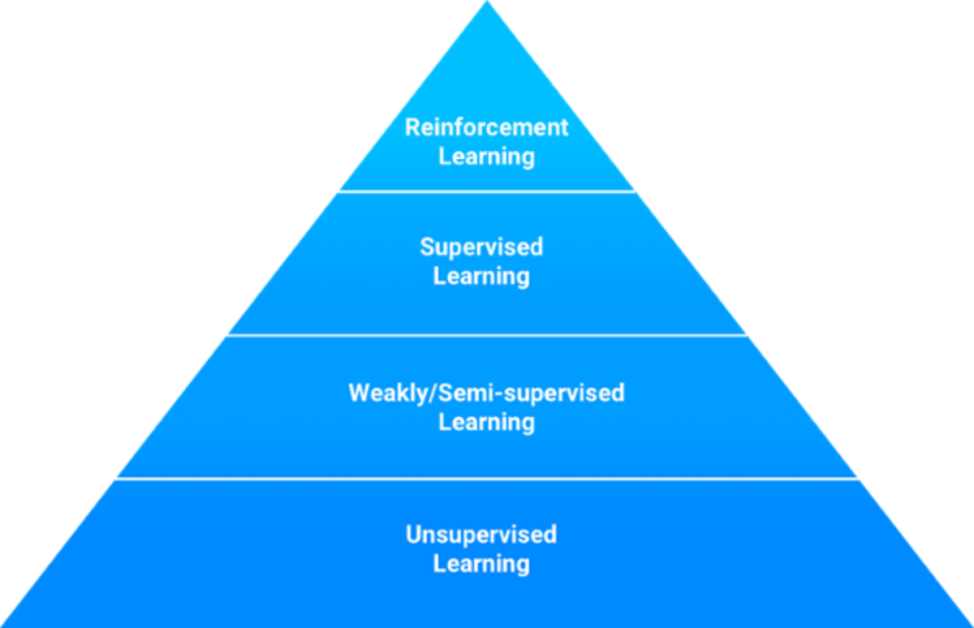
The 4 types of data to train Machine Learning models for IT Operations
Read about the 4 types of data to train Machine Learning and AI models for IT Operations in this blogpost.
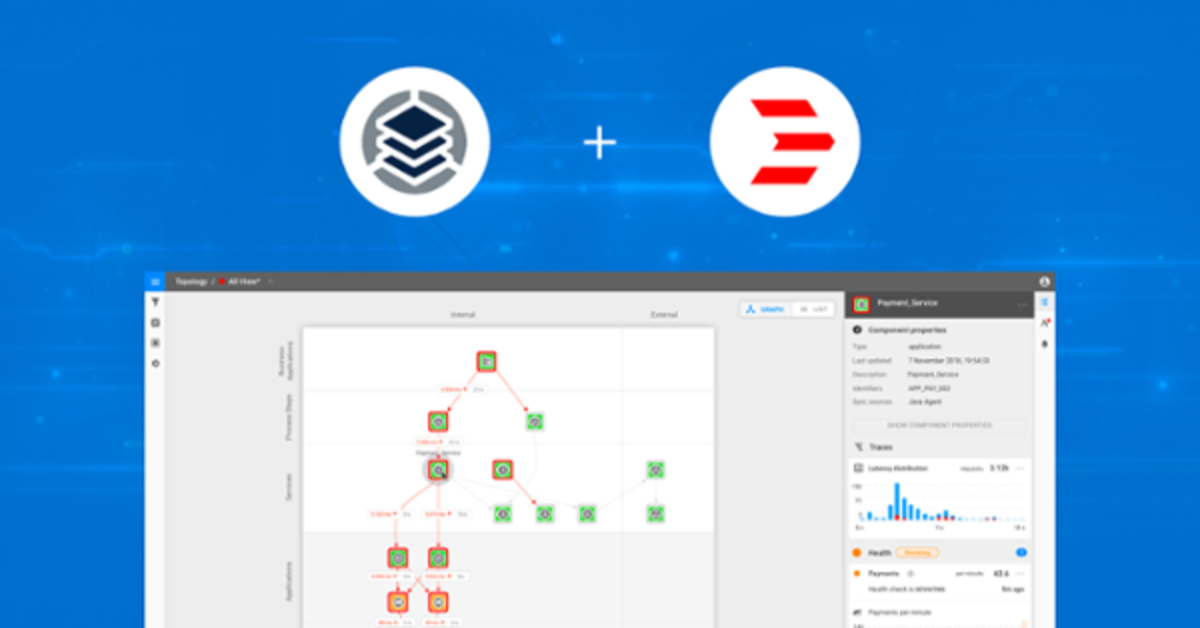
The power of AIOps: automatic remediation with StackState and Rundeck
This article describes how StackState's AIOps platform can be combined with Rundeck to set up automatic remediation for common issues.

Top 3 AIOps customer trends
Martin Lako, Customer Success and Delivery Manager at StackState, shares how current customers are using StackState's AIOps platform.

Relating IT issues to business KPIs with AIOps
Kostyantyn Tatarnikov, data scientist at StackState, explains how you can relate IT issues to business KPIs with AIOps.
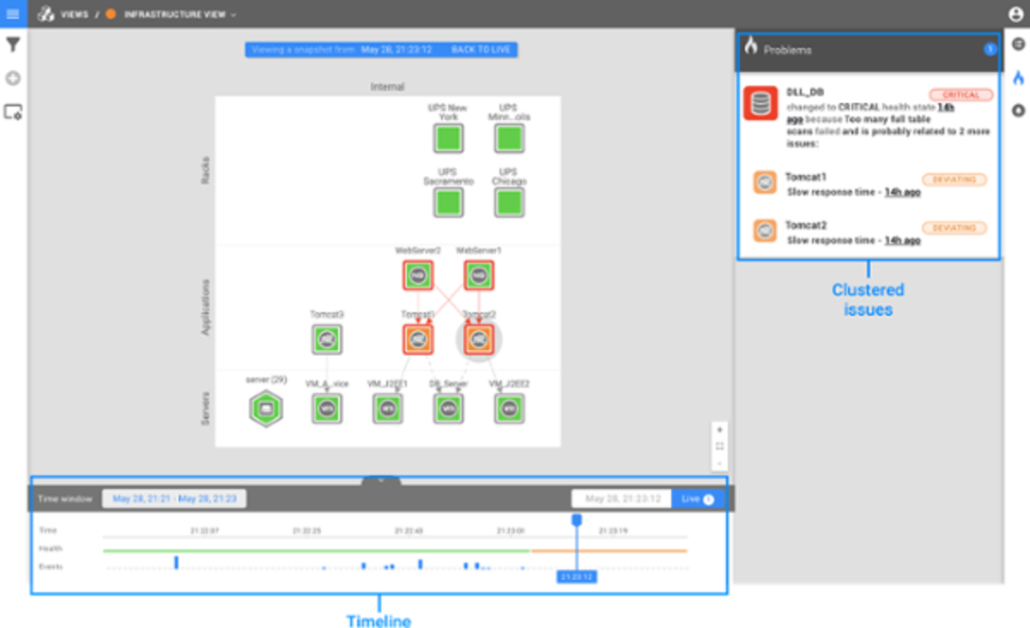
Time Travel for AIOps: root cause analysis simplified
One of the most exciting updates is our improved time travel capability that helps IT operators to root cause issues instantly.

Predicting business impact with AIOps
SackState’s mission is to ease the complexities of running and evolving the digital enterprise by providing a high-quality, impact-free IT landscape.
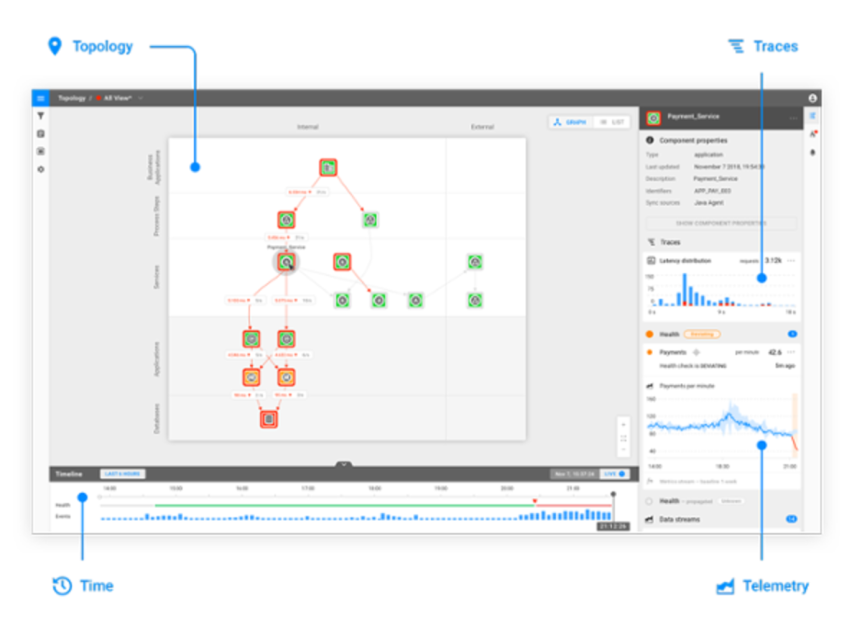
Realizing the full potential of AIOps
In the context of AIOps: what kind of data is there and what kind of data do we need to automate the operations of complex IT systems?
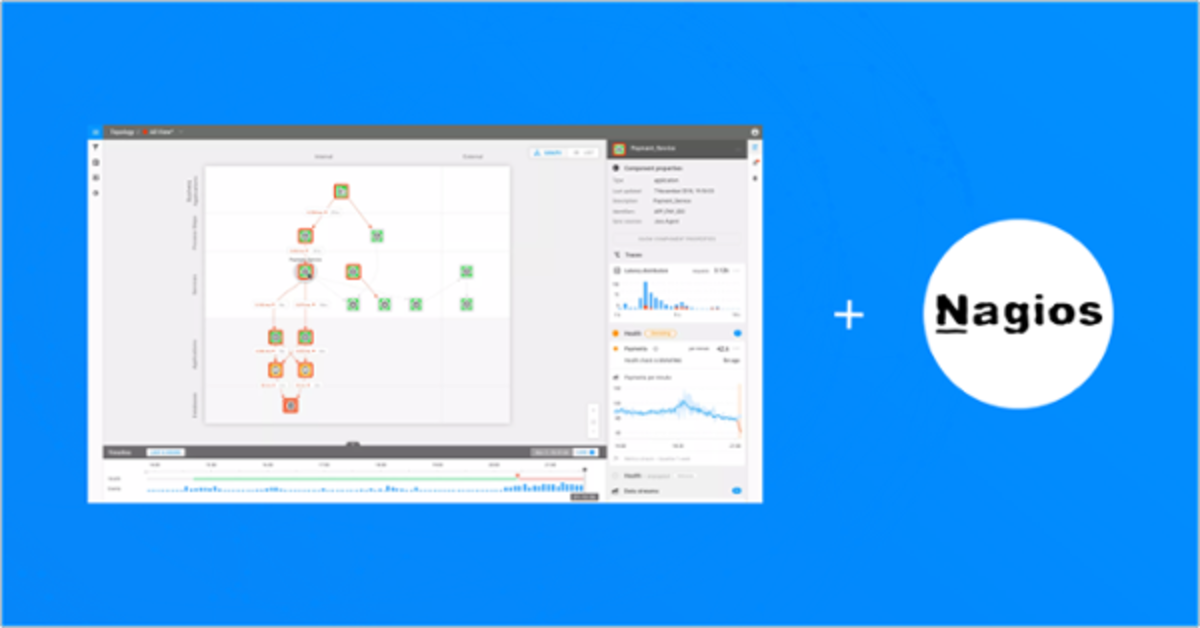
StackState AIOps now integrates with Nagios
StackState now integrates with Nagios, providing observability, monitoring and intelligence across your entire IT landscape.

The Black Hole Image and AIOps. What do they have in common?
The process of generating the Black Hole image and the challenges they overcame, are very relatable to the challenges we see in IT organizations.
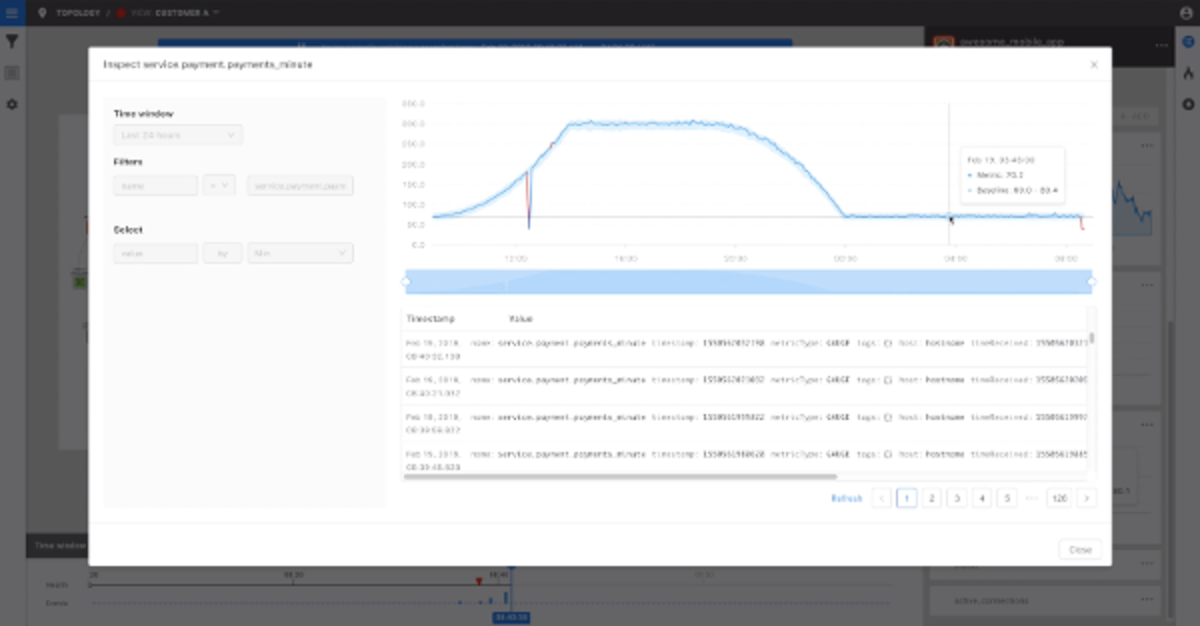
AIOps: Anomaly Detection Using Deep Learning
Discover how StackState uses AIOps anomaly detection and deep learning to scale your IT infrastructure while maintaining your team's productivity.
AIOps Vendors: Domain-Centric vs. Data-Agnostic
Many monitoring vendors position themselves in the growing AIOps market. What types of vendors should you be looking for?
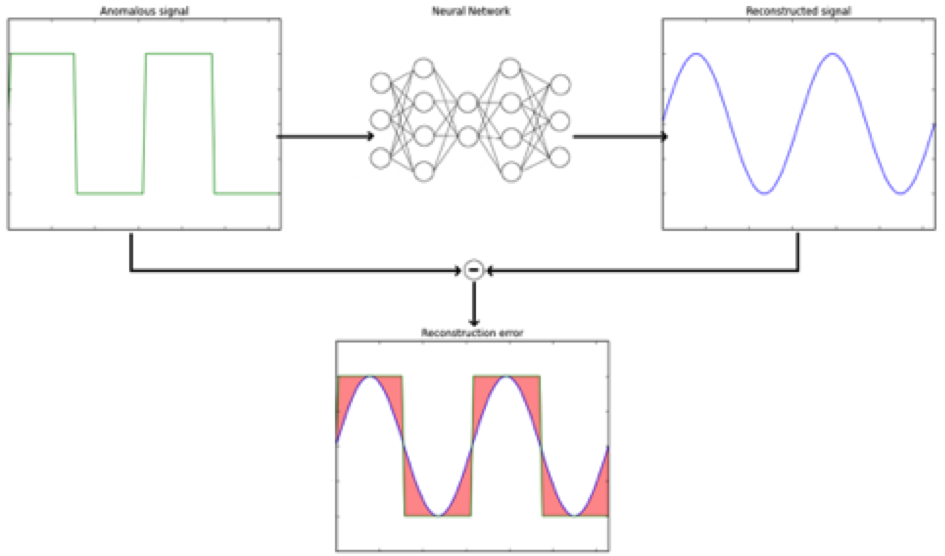
The basics of deep learning - How to apply it to predict failures
Learn the basics of deep learning and how to use it for failure prediction. The topic Deep Learning is hot!

Right Product, Right Team, Right Time: Why I Joined StackState
StackState's Delivery Manager Martin Lako explains his reasons for joining the company. Read why he is experiencing such a thrill at StackState.

6 AIOps & Monitoring Predictions for 2019
AIOps and monitoring predictions for 2019. Let’s gaze into the crystal ball and see what 2019 holds for AIOps and monitoring. Here are our best six.

What is monitoring sprawl and what to do about it?
Different Monitoring tools and technologies appear in any growing technology organization. As long as you consider each department in isolation.

Next-Gen Monitoring: Time Travel for AIOps
Learn how StackState AIOps accelerates and simplifies the way you root-cause issues across the IT environment with its Time Travel capability.

How IT silos slow down your business and how AIOps can help
Learn how an AIOps Platform can help your business from three real-life examples of what happens when IT Ops teams and technologies do not cooperate efficiently.
3 Benefits of a Model-Based AIOps Platform
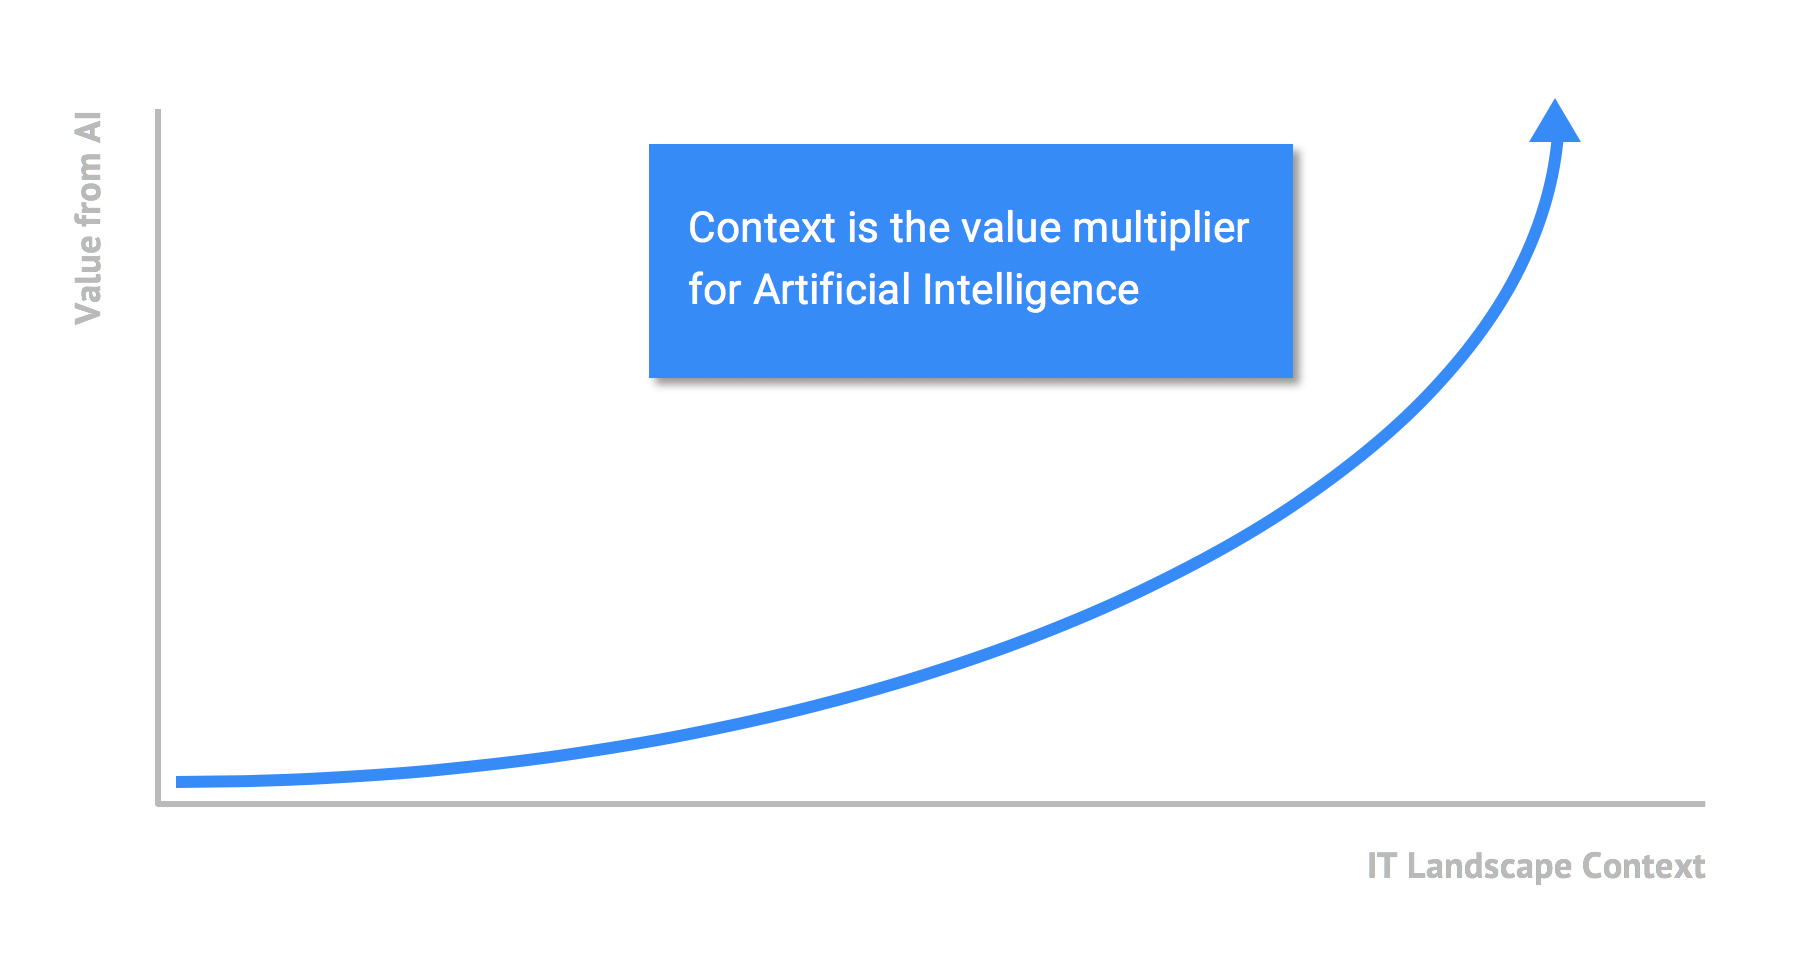
We highlight 3 benefits of using a model-based AIOps platform to collect IT operations data and explain how AI is being used to generate insights from that data.

6 Signs Your IT Operations Teams Need Better Monitoring
Here are 6 signs that your IT Operations teams need better monitoring. Is your IT operation showing any signs? Read it here.

The Ultimate IT Monitoring Spotify Playlist
Monitoring your IT landscape can be complex and challenging. We have created the Ultimate IT Monitoring Spotify Playlist.
Top 3 Cloud Migration Monitoring Challenges You Can Tackle With AIOps
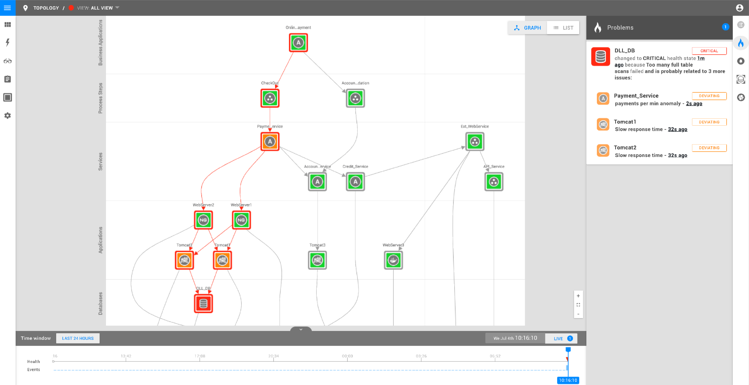
Cloud migration can be a massive undertaking. Here’s an overview of the top 3 cloud migration monitoring challenges you solve with AIOps.

Discover Your Monitoring Maturity Level. Take The Test!
The Monitoring Maturity Model reflects the four stages of monitoring. Take this 1-minute test to discover your monitoring maturity level.
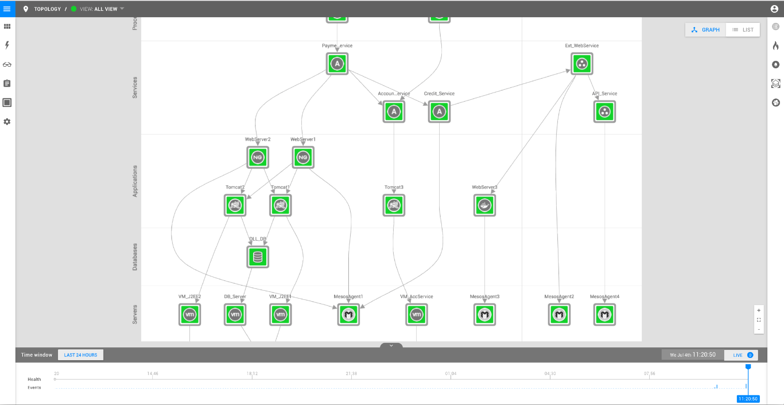
Intelligent Alert Clustering: How StackState Helps You Against Alert Storms
StackState’s AIOps product helps users weather the storm by combining related alerts into a single problem card and pinpoint the root cause.
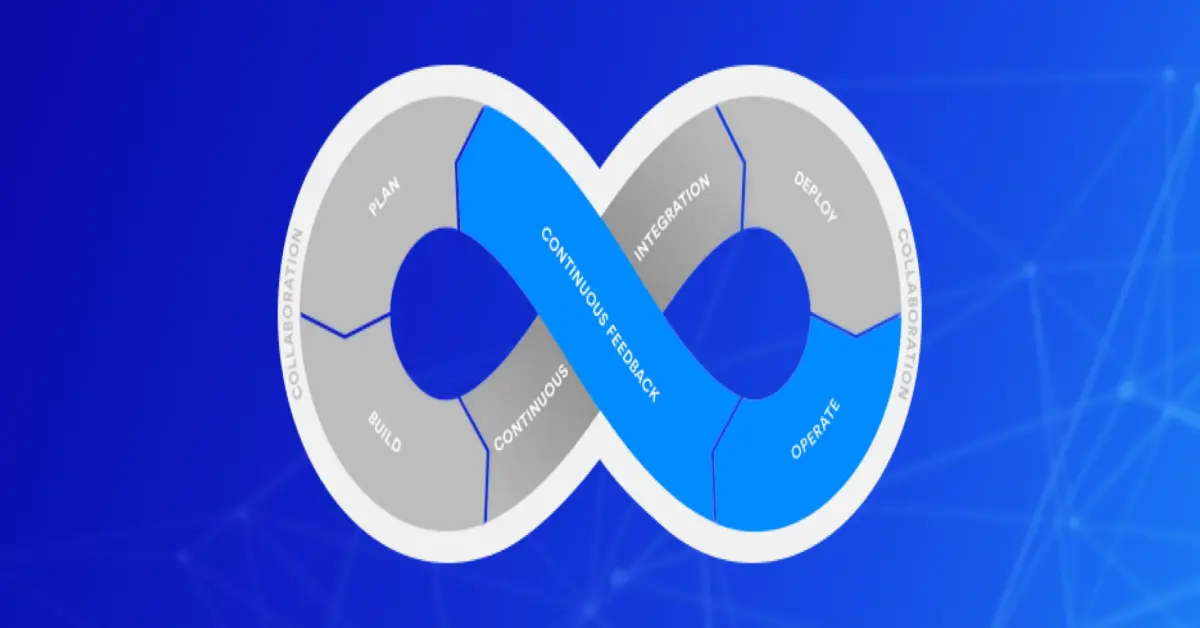
4 Situations Where AIOps Accelerates Software Development
AIOps is a new trend that is going around in IT Operations. While the benefits for IT Operations are fairly clear, will this trend benefit developers?
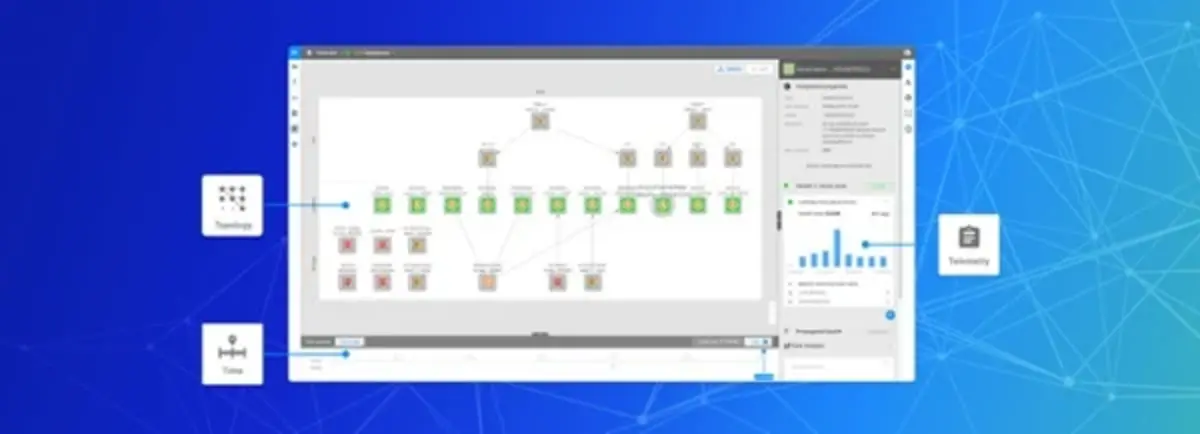
From ITOA to AIOps: 3 Differences You Should Know
What are the differences between ITOA and AIOps? In this blog I will dive into the both of them, how they differ and how they align.
Stable Continuous Delivery with StackState and XebiaLabs XL Release
Learn how StackState ensures a stable and smooth continuous delivery pipeline with its XL Release integration!

StackState Sponsor of DevOpsDays Amsterdam 2018
StackState is proud to be a sponsor of DevOpsDays Amsterdam 2018. Come meet the StackState teams and get your private live demo.

What is AIOps and Why Should You Care?
What is AIOps and Why Should You Care? I will cover all espects you need to know about AIOps in this blog.
StackState Announces AWS Cloud Monitoring
StackState delivers an all-in-one solution to monitor AWS cloud environments. Get a real-time picture of your entire AWS environment.

StackState is Headed to Gartner ITIOM 2018 in Frankfurt
Visit us in Frankfurt, Germany at the Gartner IT Infrastructure and Operations Management Summit and get a demo of StackState.

Collecting Critical Evidence for Faster Root Cause Analysis
This post covers which evidence you need to collect to accelerate your root cause analysis process.
Supporting Continuous Deployments with StackState and XebiaLabs XL Deploy
StackState now ships with an out-of-the-box integration with XL Deploy, a leading deployment automation product from our sister company XebiaLabs.
Artificial Intelligence for IT Operations: a Complimentary Guide
After reading this guide, you will gain an understanding of Artificial Intelligence for IT Operations (AIOps) and how it works.
You've Got a Great Data Lake, Now What?
Mark Arts, Senior Technical Sales Engineer at StackState, explains how you can get more value out of your current data lake.
AIOps for Microsoft Azure Environments
Learn how to apply Artificial Intelligence for IT Operations to your Microsoft Azure environment with StackState.
Is Root Cause Analysis Dead or Are We Just Getting Started?
Discover what contextual root causes are and learn the importance of getting rid of the idea of a 1 to 1 mapping between problem and root cause.
How to monitor NGINX with StackState
Learn how to monitor NGINX with StackState and why it's key to visualize the entire IT stack including its dependencies.
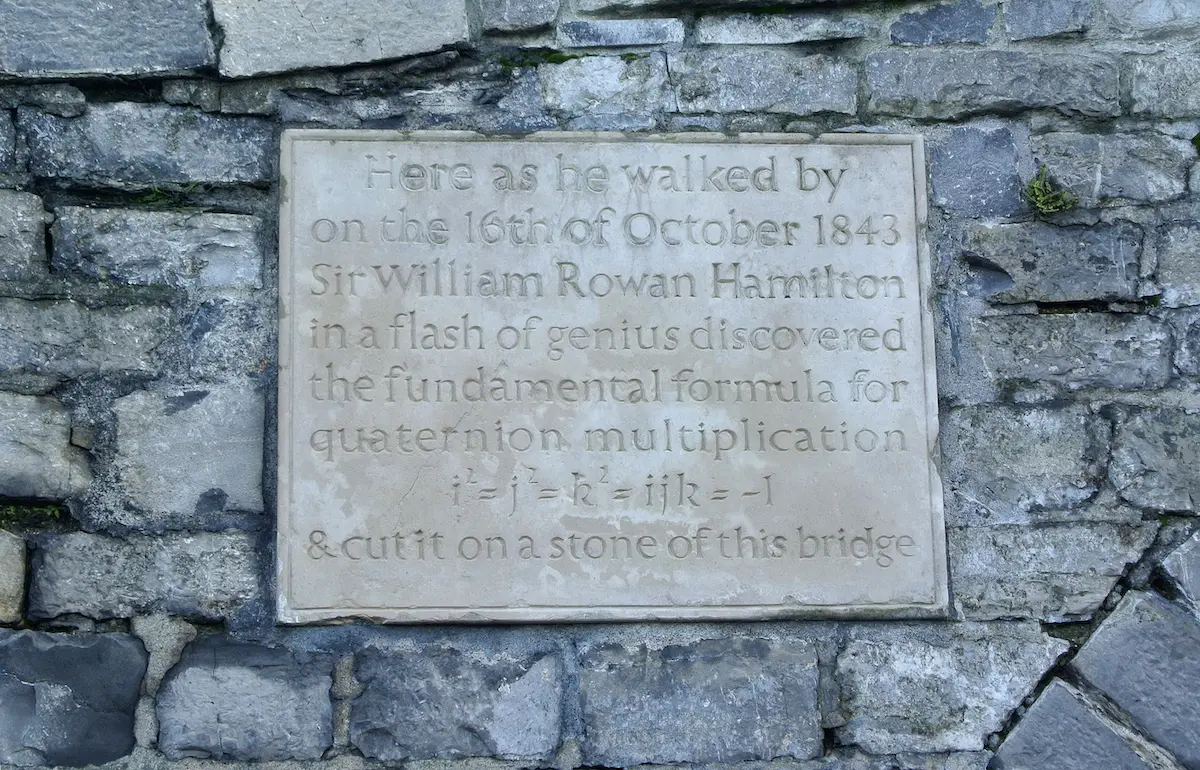
Capture Your Entire IT Stack in One Data Model
Lodewijk Bogaards, CTO of StackState, explains the 4T Data Model (Telemetry, Topology, Traces and Time) of the StackState observability platform.
Monitor Docker with StackState - Part 4
This post is part 4 in a 4-part series about Container Monitoring. This article describes how to monitor your Docker containers with StackState.
How to monitor a Kubernetes environment - Part 3
Part 3 of a 4 part series about Container Monitoring that describes the challenges of monitoring Kubernetes and what it means to your monitoring strategy.

Monitor Mesos with StackState - Part 2
This post is part 2 in a 4-part series about Container Monitoring. This article describes how to monitor your Mesos cluster.
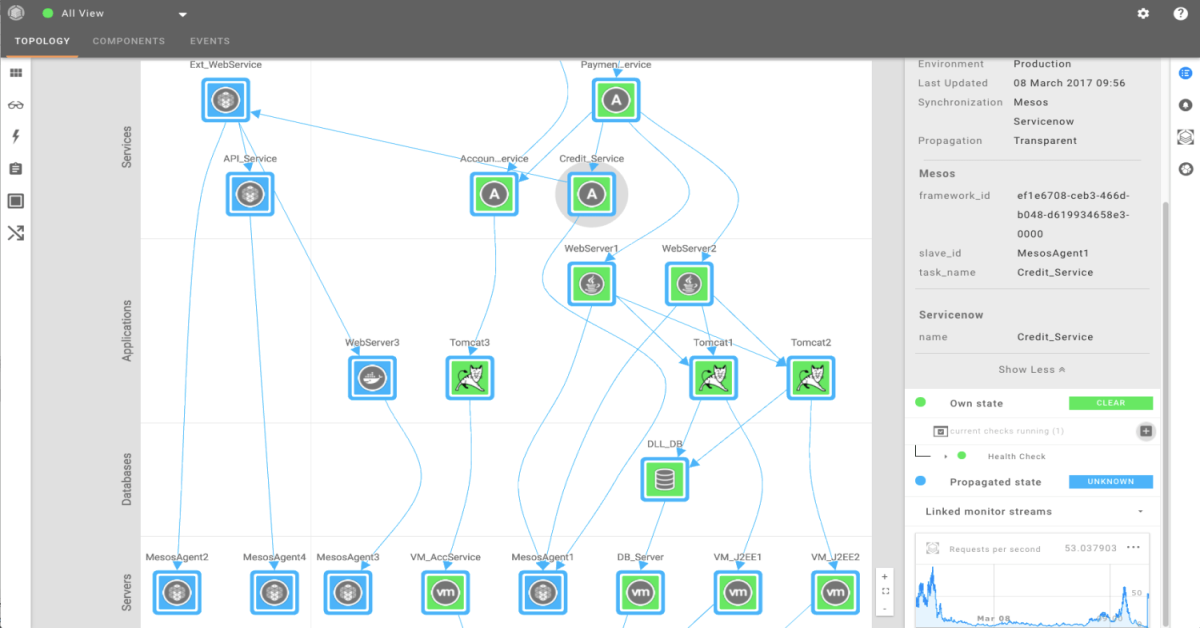
The Container Monitoring Problem - Part 1
Monitoring containers and the performance can be challenging. Read the top 3 challenges you need to know and overcome for container monitoring.
8 Predictions for DevOps in 2017
Top predictions for DevOps in 2017. Be sure to read the eight expert predictions you'll see in 2017.
Automate incident investigation to save money and become proactive
How many hours did your best engineers spend investigating incidents and problems last month? Our apporach to become proactive in troubleshooting.

Why don’t monitoring tools monitor changes?
Changes in applications or IT infrastructure can lead to application downtime. StackState correlates, aggregates and merges all monitoring tools.

Let Operational Analytics improve your business
Operational Analytics is becoming more and more popular. Find out what Operational Analytics means and how it can improve your business.

An answer to the alert storm: introducing Team View Alerts
Do you know which alert notifications need your attention and which ones do not? Read this blog post to learn how to deal with this.
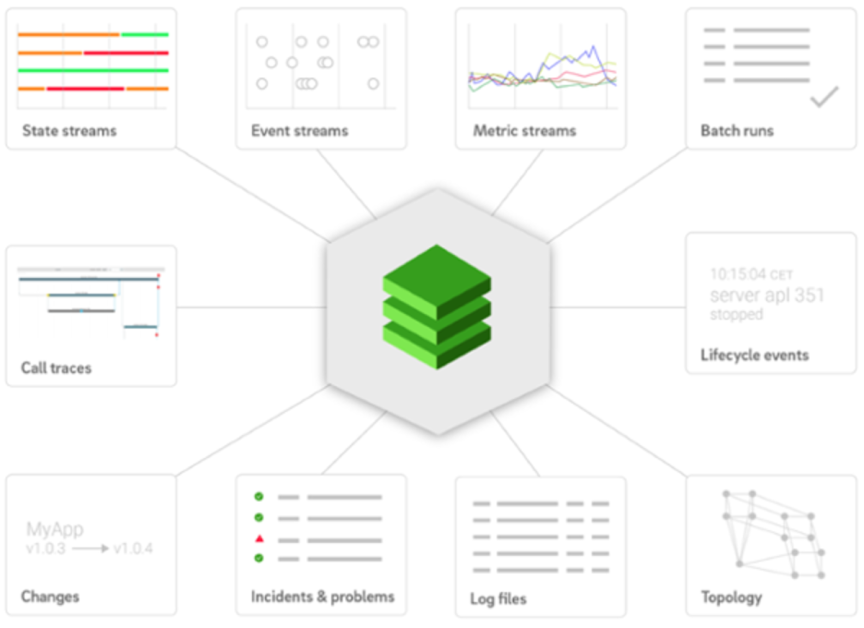
The model behind a dynamic real-time IT blueprint
StackState captures topology info, telemetry info and log info and combines that into a real time model of your IT stack.

StackState counts down to public release
StackState is counting down to public release. Sign up and be the first to install and use our new IT operations platform.

Are all those IT Ops tools driving you crazy?
IT Ops use a lot of different tools to do their job. Can you still see the wood for the trees? Read this blog.
The Perfect IT Ops World
Let's imagine, for a moment, a perfect IT Ops world. What would it look like? Read this blog post and get to know!

Are SLAs in IT Service Management dead?
Service Level Agreements outcomes should result in a happy customer, but is this actually the case? Read this blog.

Major challenges IT Operations have to deal with
The pressure for IT operations to keep everything up and running keeps growing. Here are the biggest problems IT operations have to deal with.
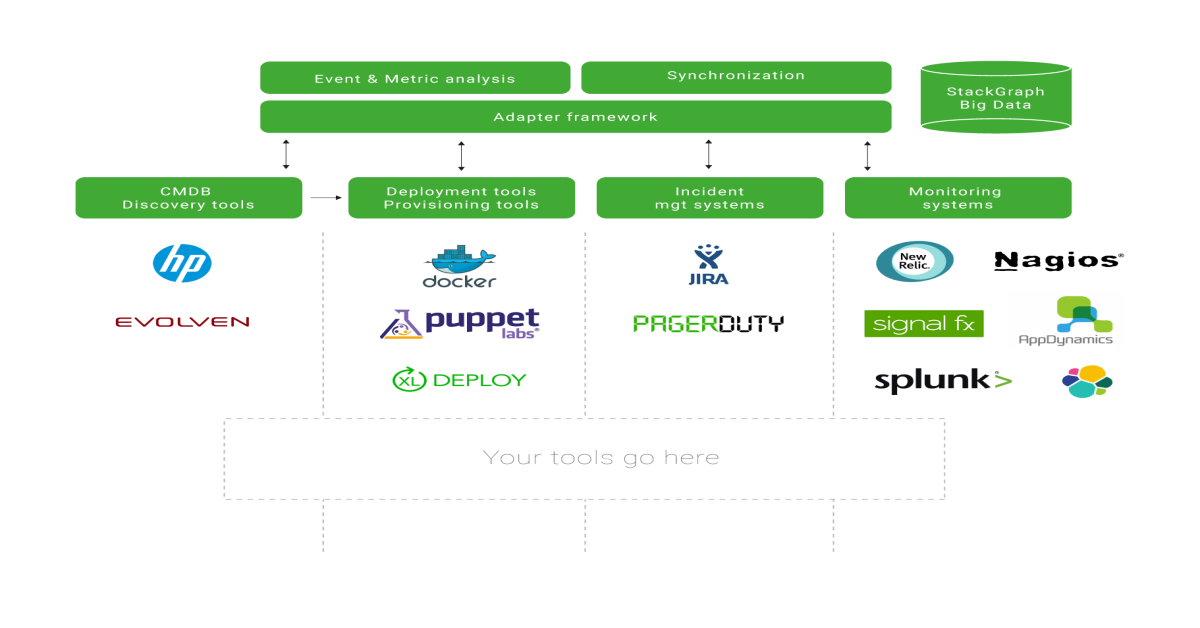
Autonomy (in Dev/Ops tooling) does not equate loss of control
Should DevOps teams use the same kind of tools between different teams, or should they have freedom in choosing the technologies/products they need?
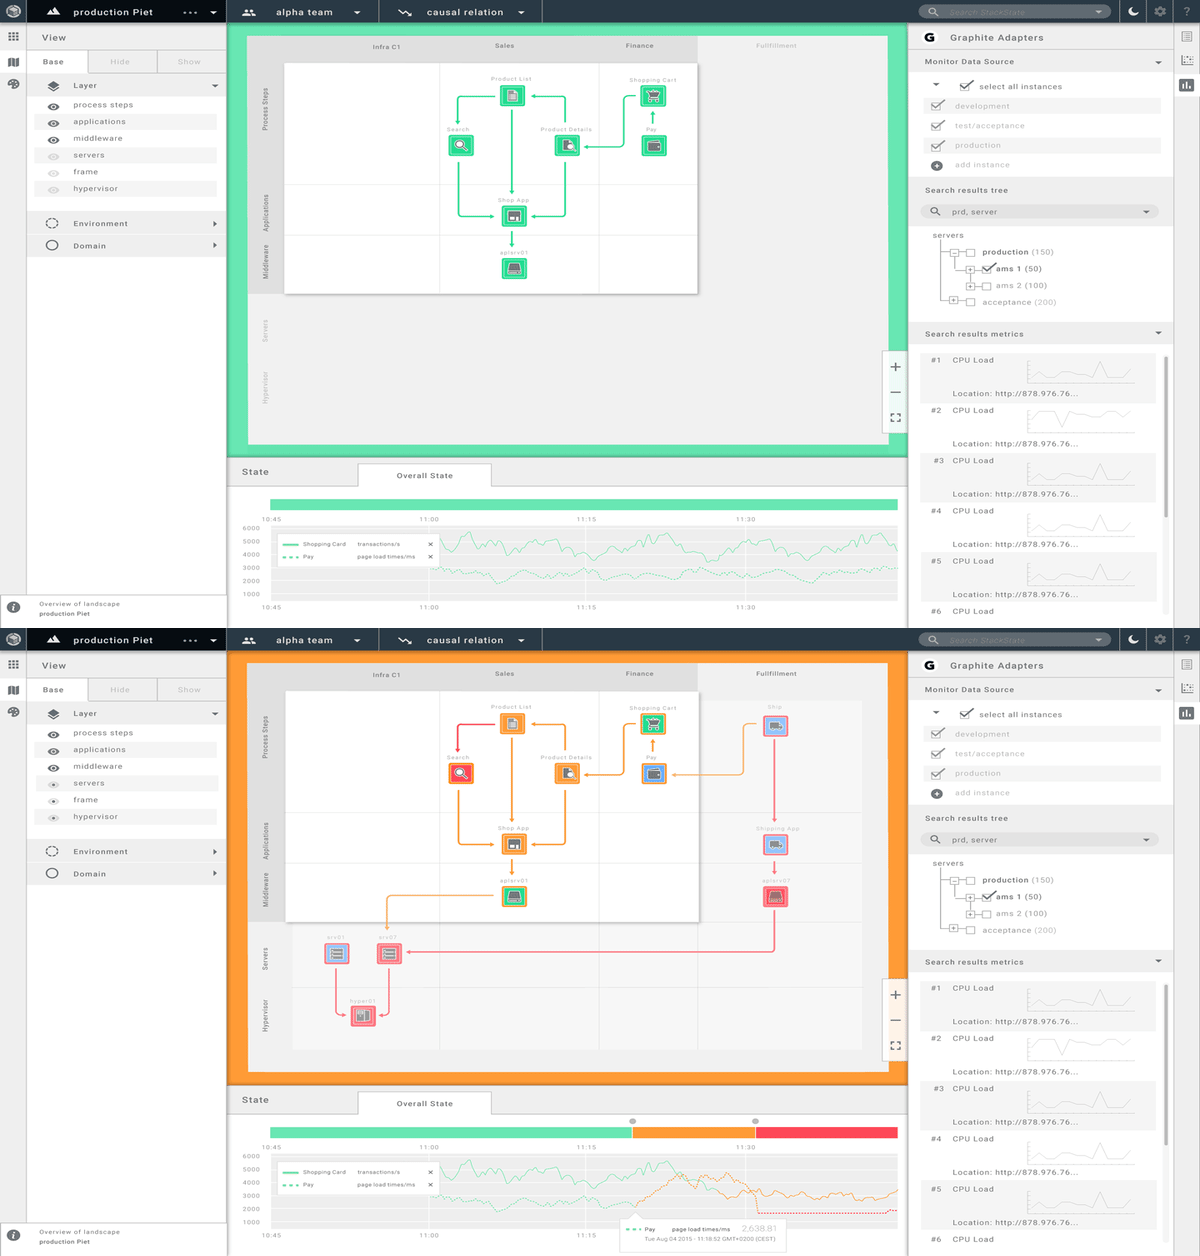
Preventing surprises with a realtime visual model of the IT Stack
Everybody should have a full visual overview of the whole IT Stack. With unified monitoring you can prevent surprises in your IT stack.
Smart IT monitoring and root cause analysis needs big data
Big data will change how IT departments will do root cause analysis and manage and control their whole IT Stack to improve their service levels.


