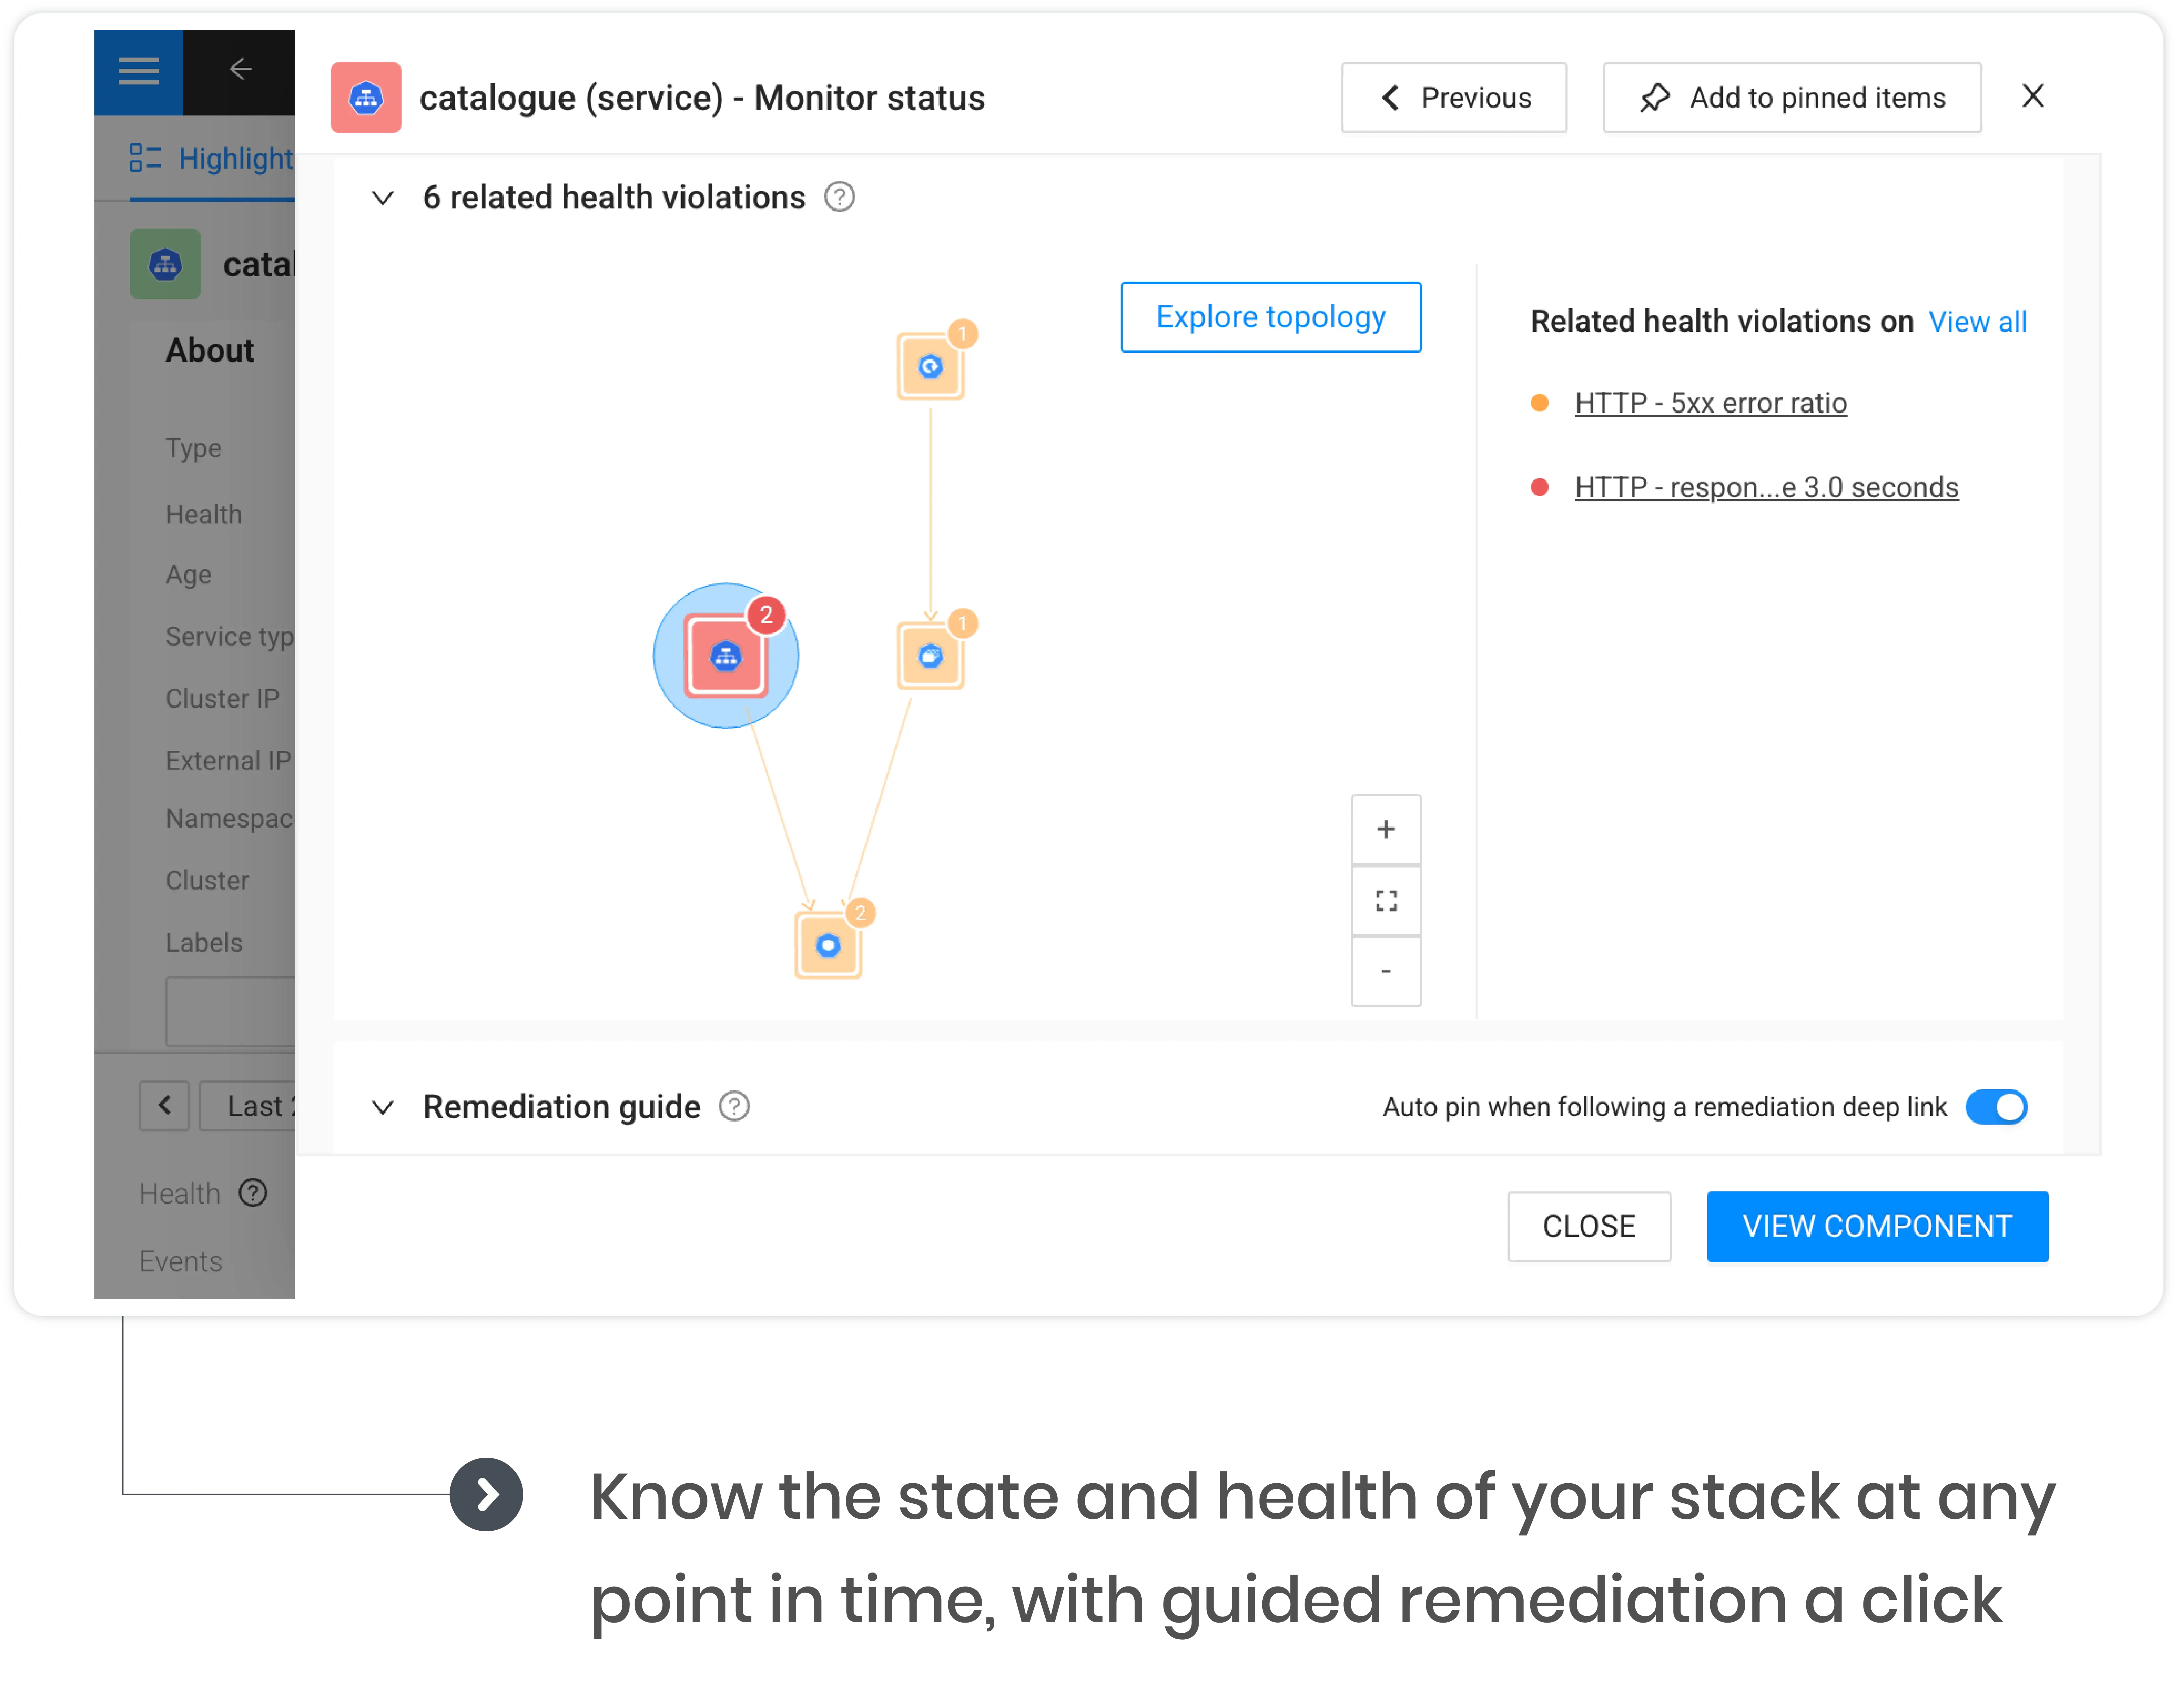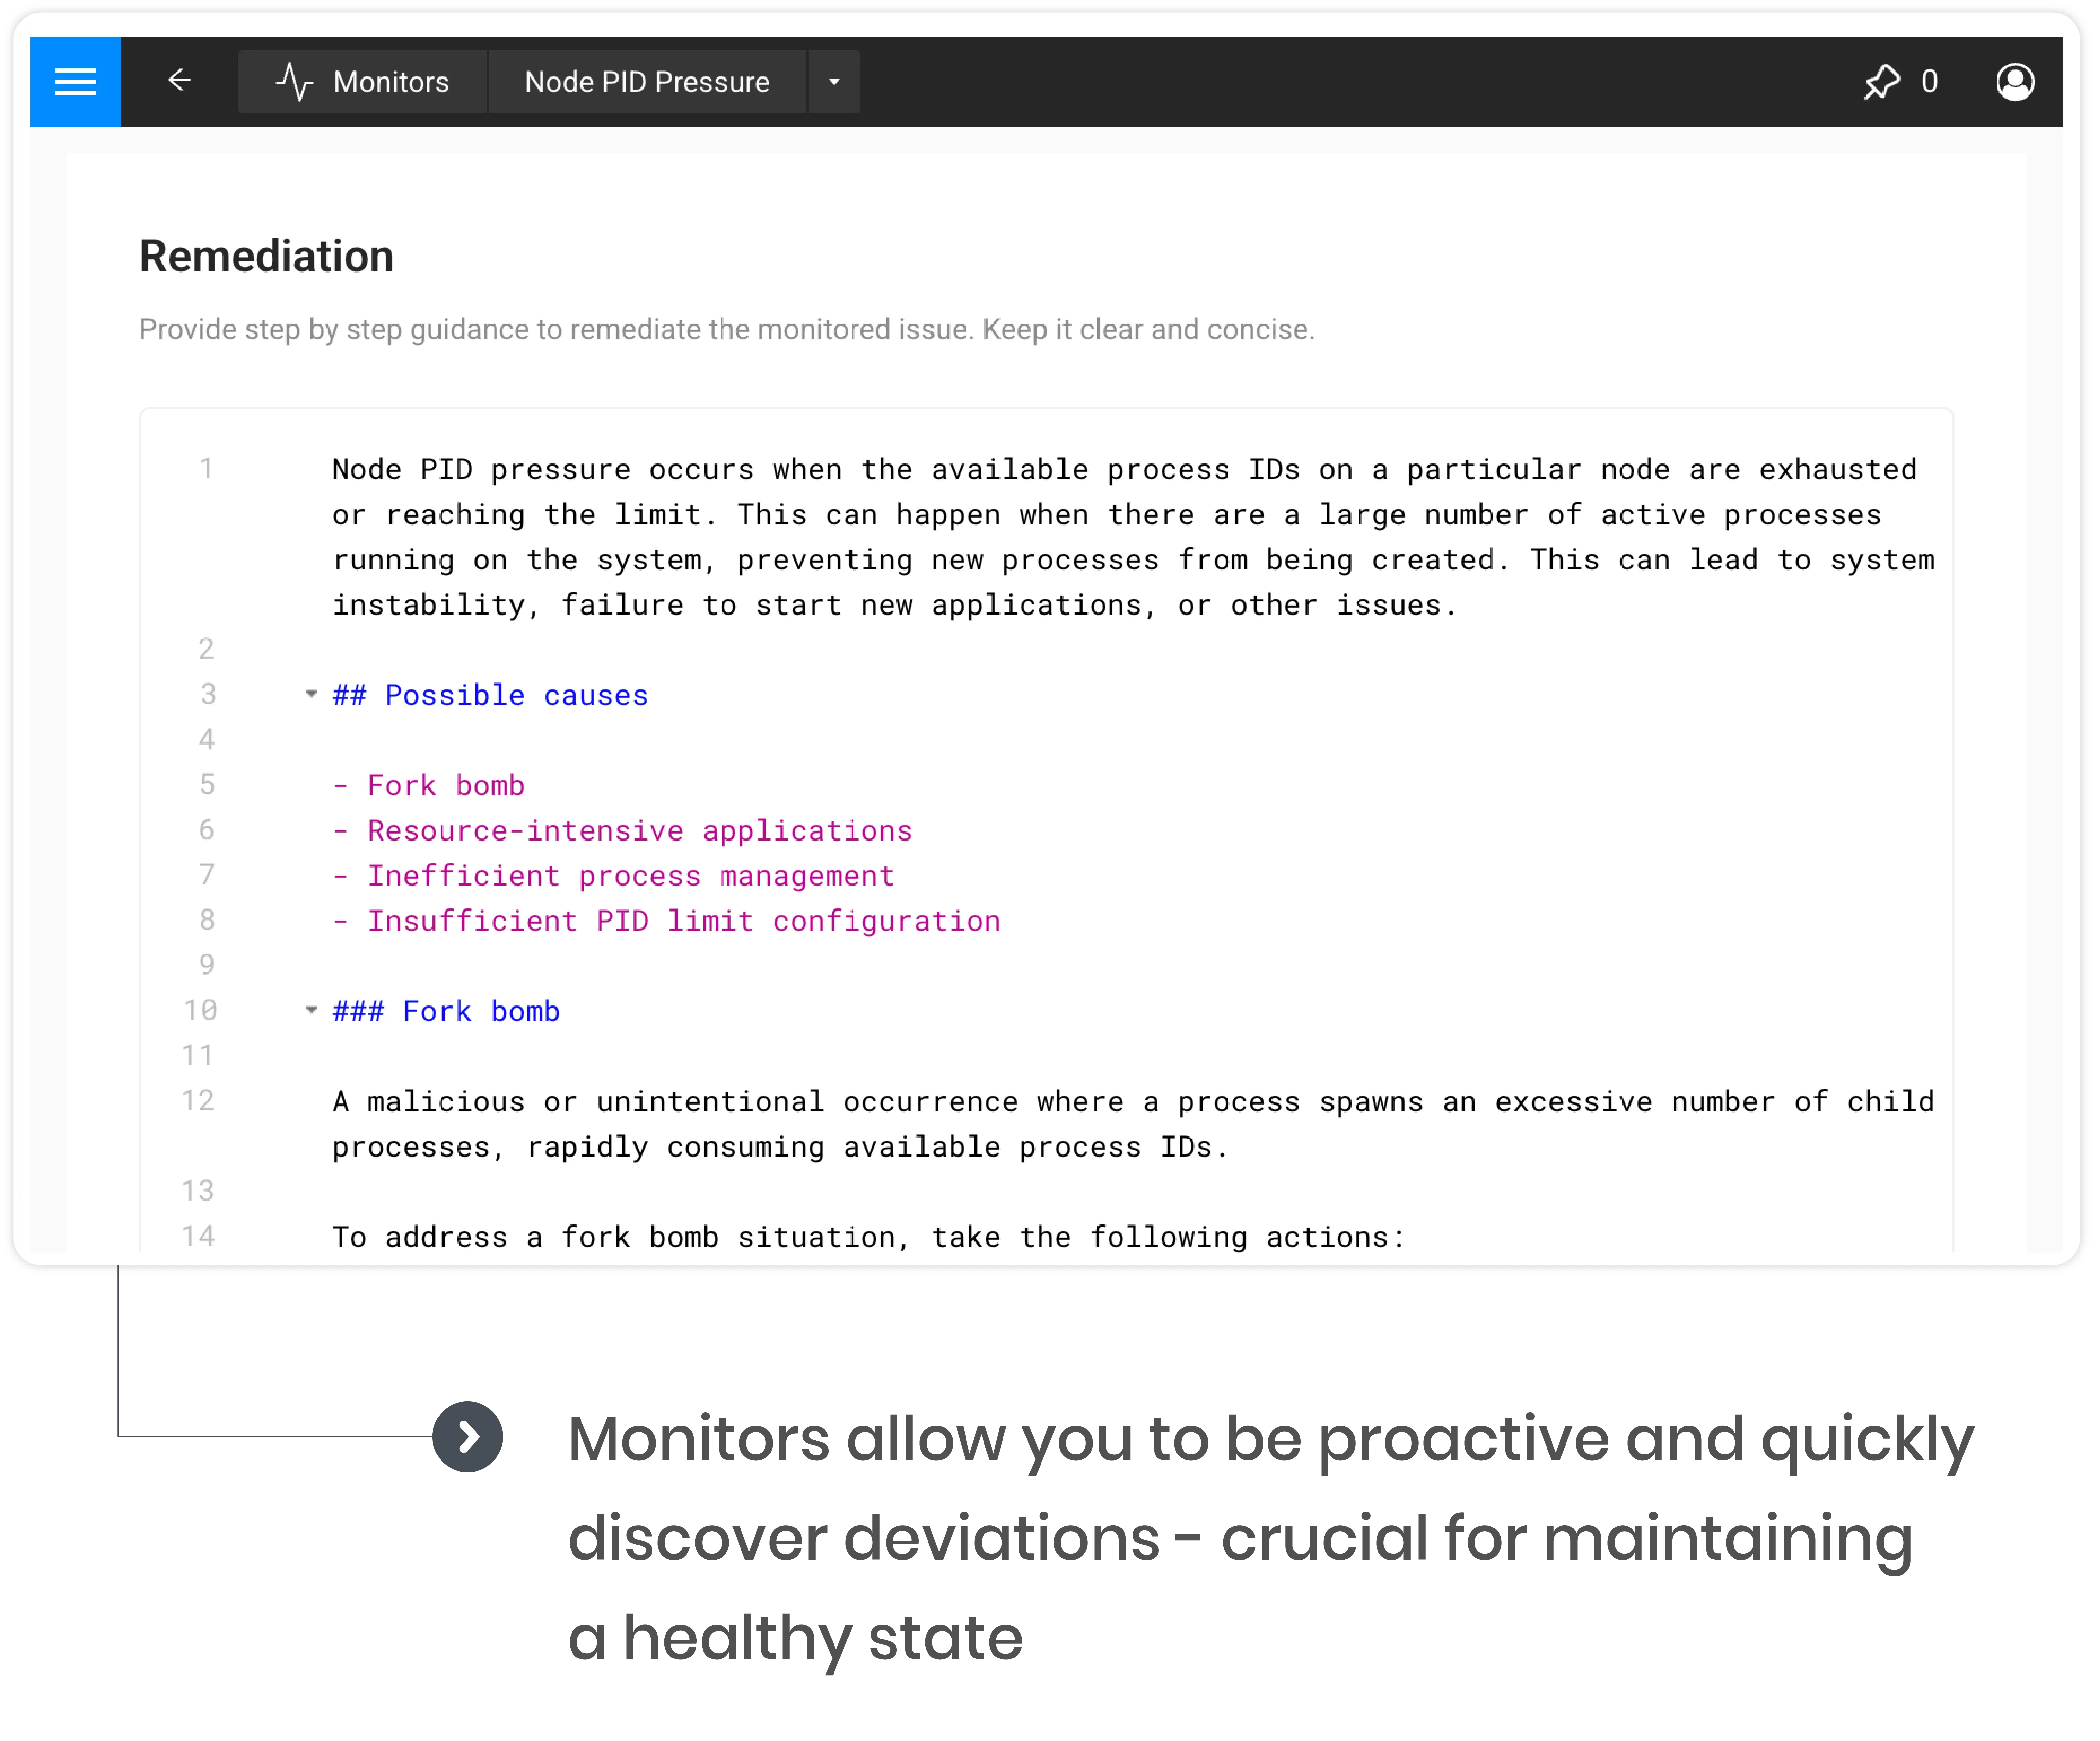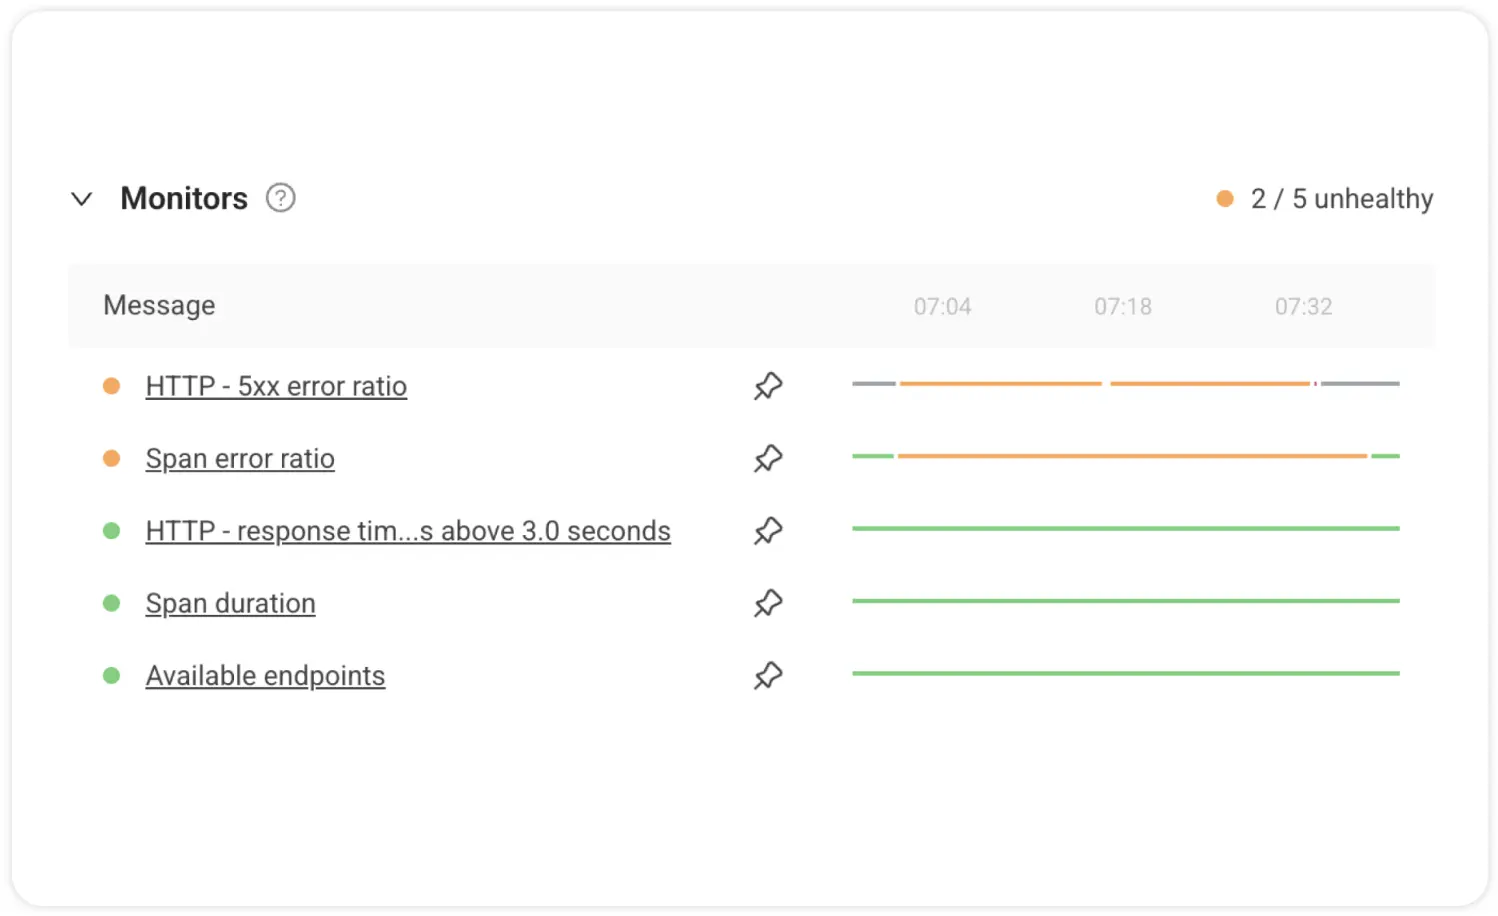
Monitor component and resource health for 360° troubleshooting
Track metrics, events, logs, topology, and metadata for comprehensive oversight
Detect common issues and ensure compliance with industry standards
Align platform and software teams to ensure service stability, scalability, and reliability
Detect unusual behavior on service endpoints
Monitor memory usage for optimal system performance
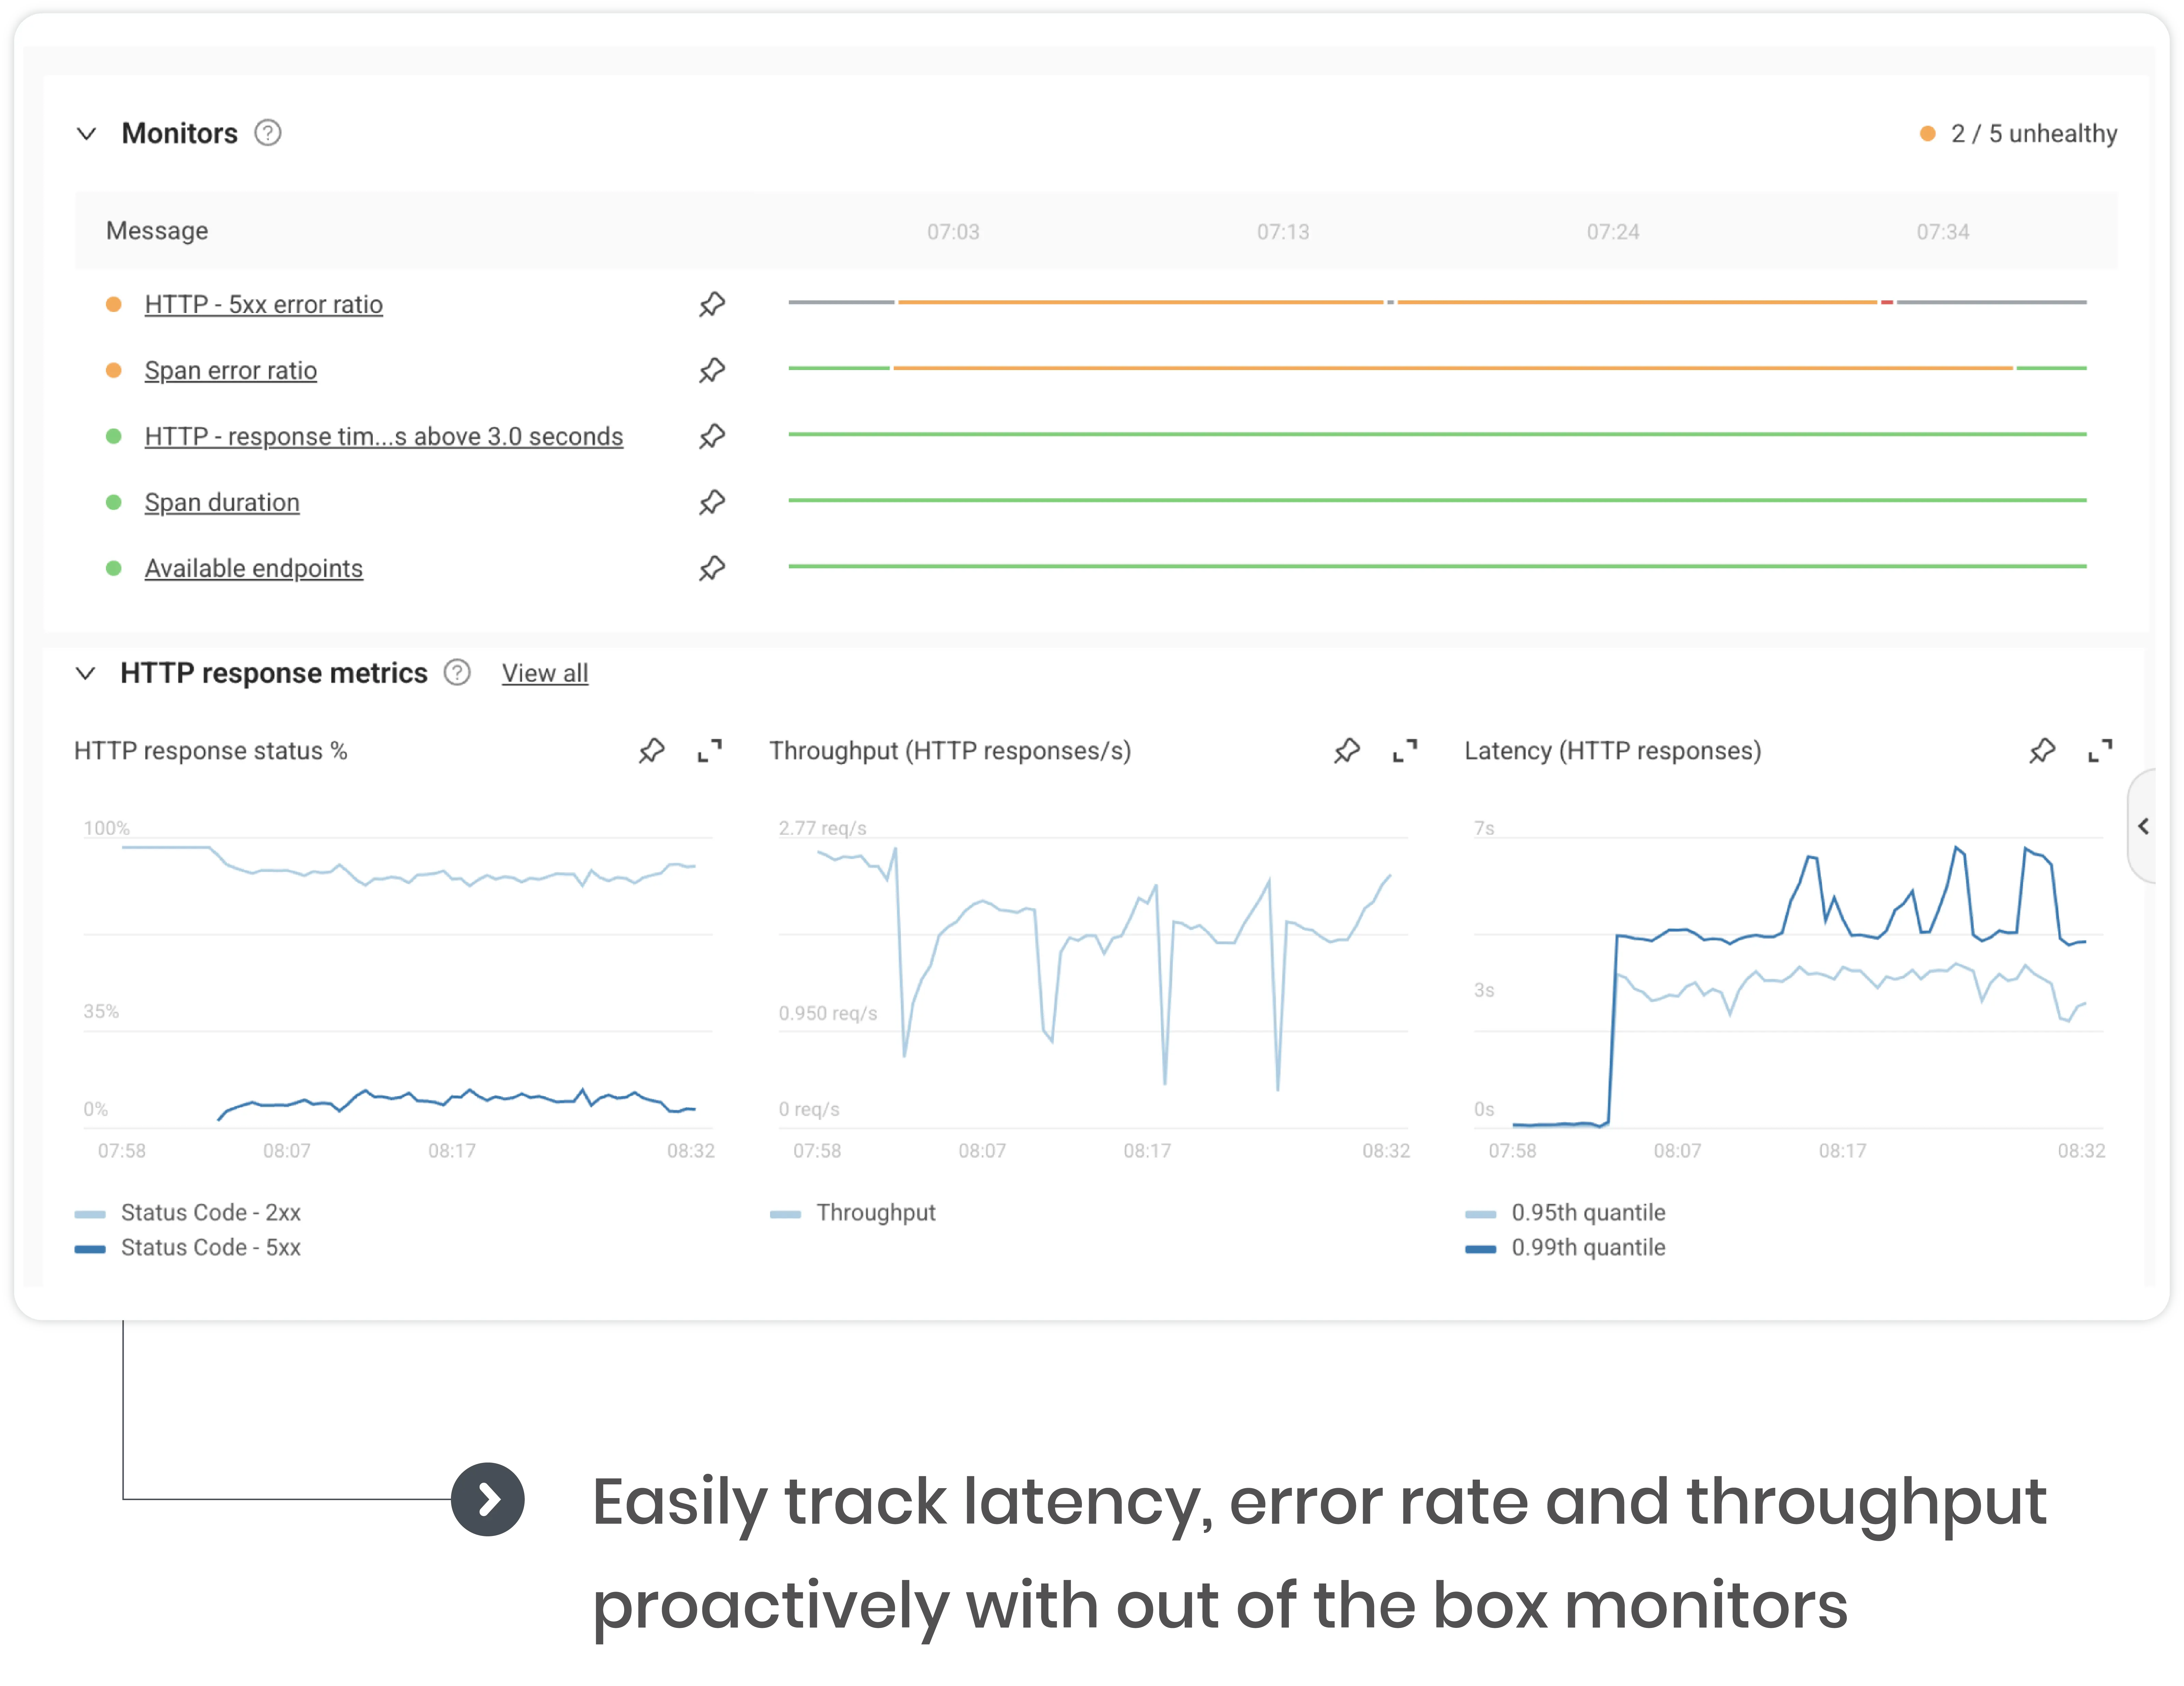
Track latency, error rate, throughput, and other golden signals to help app teams monitor SLAs, KPIs, and OKRs
Enhance your performance with industry-leading monitoring activated immediately upon setup
Customize ready-to-use monitoring to suit your needs while consolidating performance data from existing tools into a unified topology; use it to alert teams to an issue’s root cause and the fastest remediation.
StackState not only monitors particular metrics, it monitors patterns in the configuration of resources, providing the ability to issue warnings when routines are broken.
Do StakeState monitors really come in a box?
Imagine a state-of-the-art, low-overhead discovery service.
The term "out-of-the-box" signifies the immediate usability of a product as soon as it’s removed from its packaging. With StackState's end-to-end observability solution, the term refers to features, functionalities, and solutions that are available and fully operational upon initial installation or setup. And while our monitors are customizable, they can be used as is, without additional configuration.
Streamlined, automated oversight
Being proactive reduces instances of reactive troubleshooting.
One compelling reason why StackState's out-of-the-box monitors should matter to you and your organization is the automated oversight they provide. These monitors vigilantly observe crucial signals to ensure the seamless operation of your applications. This automated surveillance supports stability and reliability and minimizes the risk of service disruptions.
Quick start monitoring
Pre-configured and ready to go when you are.
Setting up monitors from scratch can be daunting, demanding substantial expertise and effort. However, with StackState's full stack observability platform, users can immediately begin monitoring their applications with the pre-configured monitors, saving valuable time and eliminating the complexity associated with manual configuration. This allows teams to focus on other critical application development and maintenance tasks without spending hours on DIY monitoring services.
Customizable to meet your unique requirements
A flexible approach to safeguarding performance and reliability.
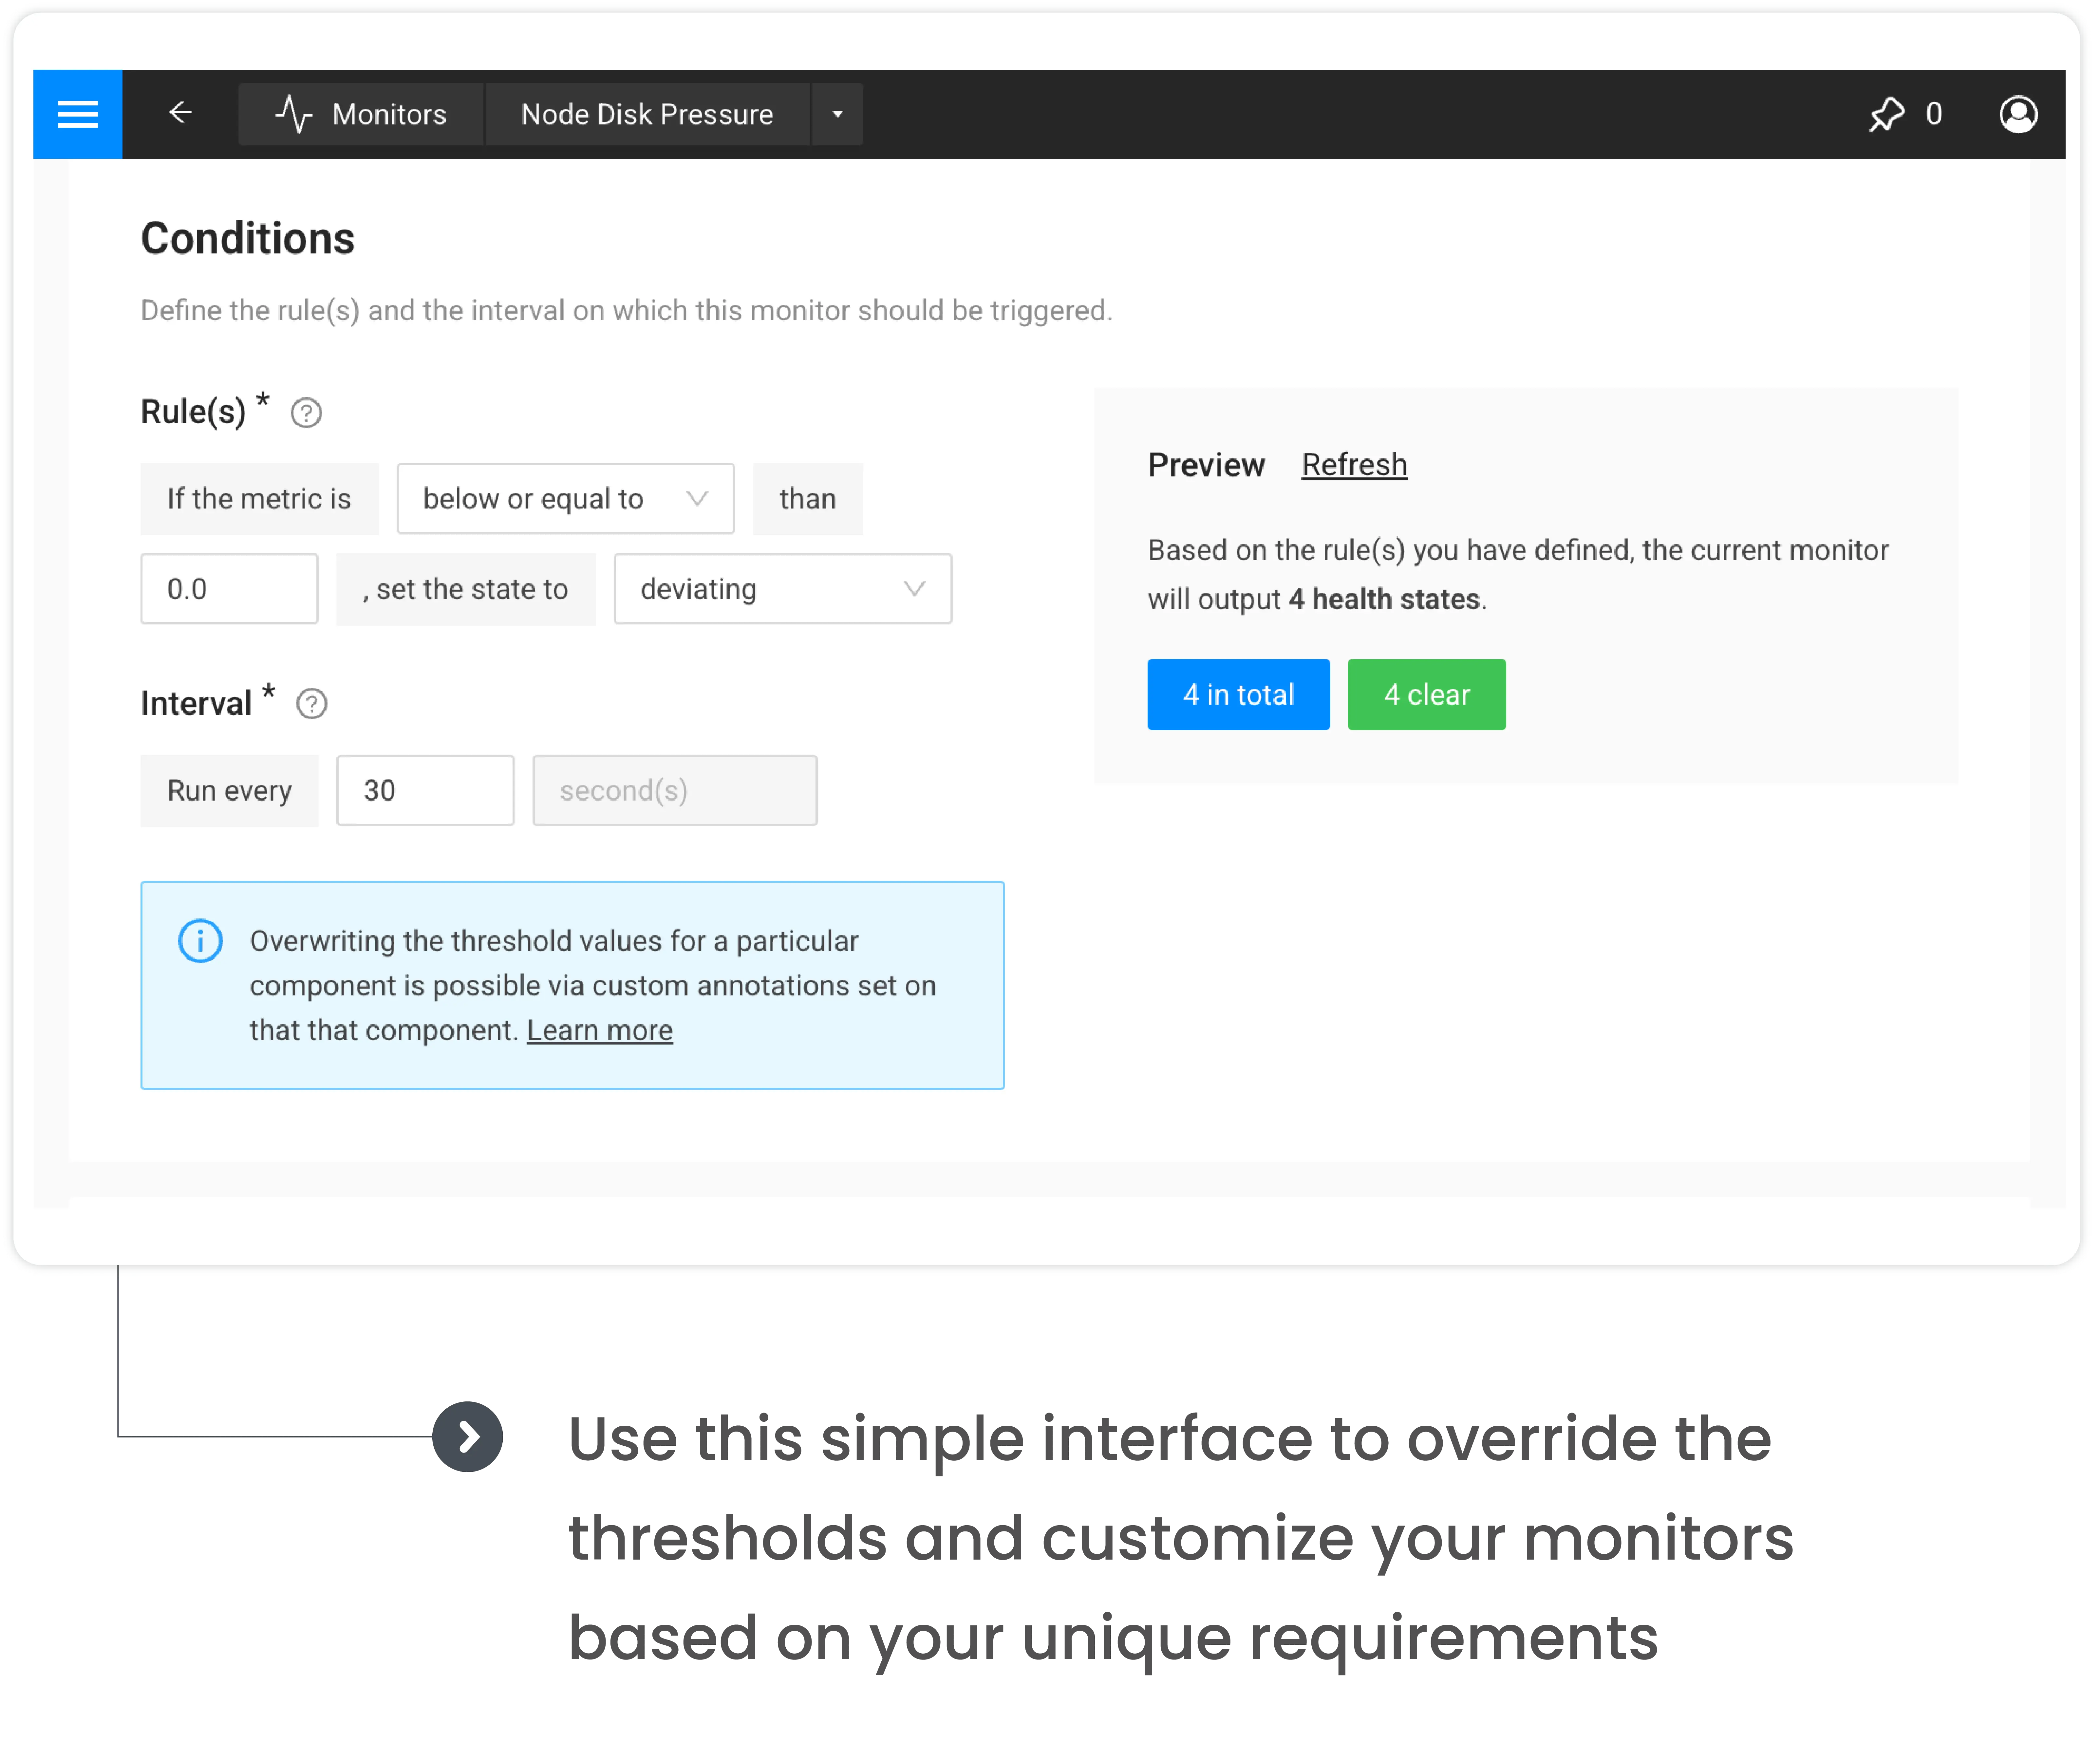
While ready-to-use monitors provide a solid foundation, StackState recognizes the importance of customization. Teams of any skill level can use the pre-made monitors as-is or tweak them to fit their particular needs. This personalization adds an extra layer of protection, ensuring that the monitoring solution aligns precisely with your application's unique requirements.
Full-stack observability starts with better monitoring
By actively observing your full stack, StackState's out-of-the-box monitors accelerate issue identification, giving your SRE teams, platform engineers and software developers a shortcut to understanding app status without distraction. When anomalies are found, our pre-configured monitors automatically issue alerts with clear steps to take to enable faster issue resolution.
Ready to optimize your team’s productivity with StackState?
Open, extensible, and easily integrates with all major cloud platforms and solutions
SOC 2 compliant • Low eBPF overhead • OpenTelemetry-native