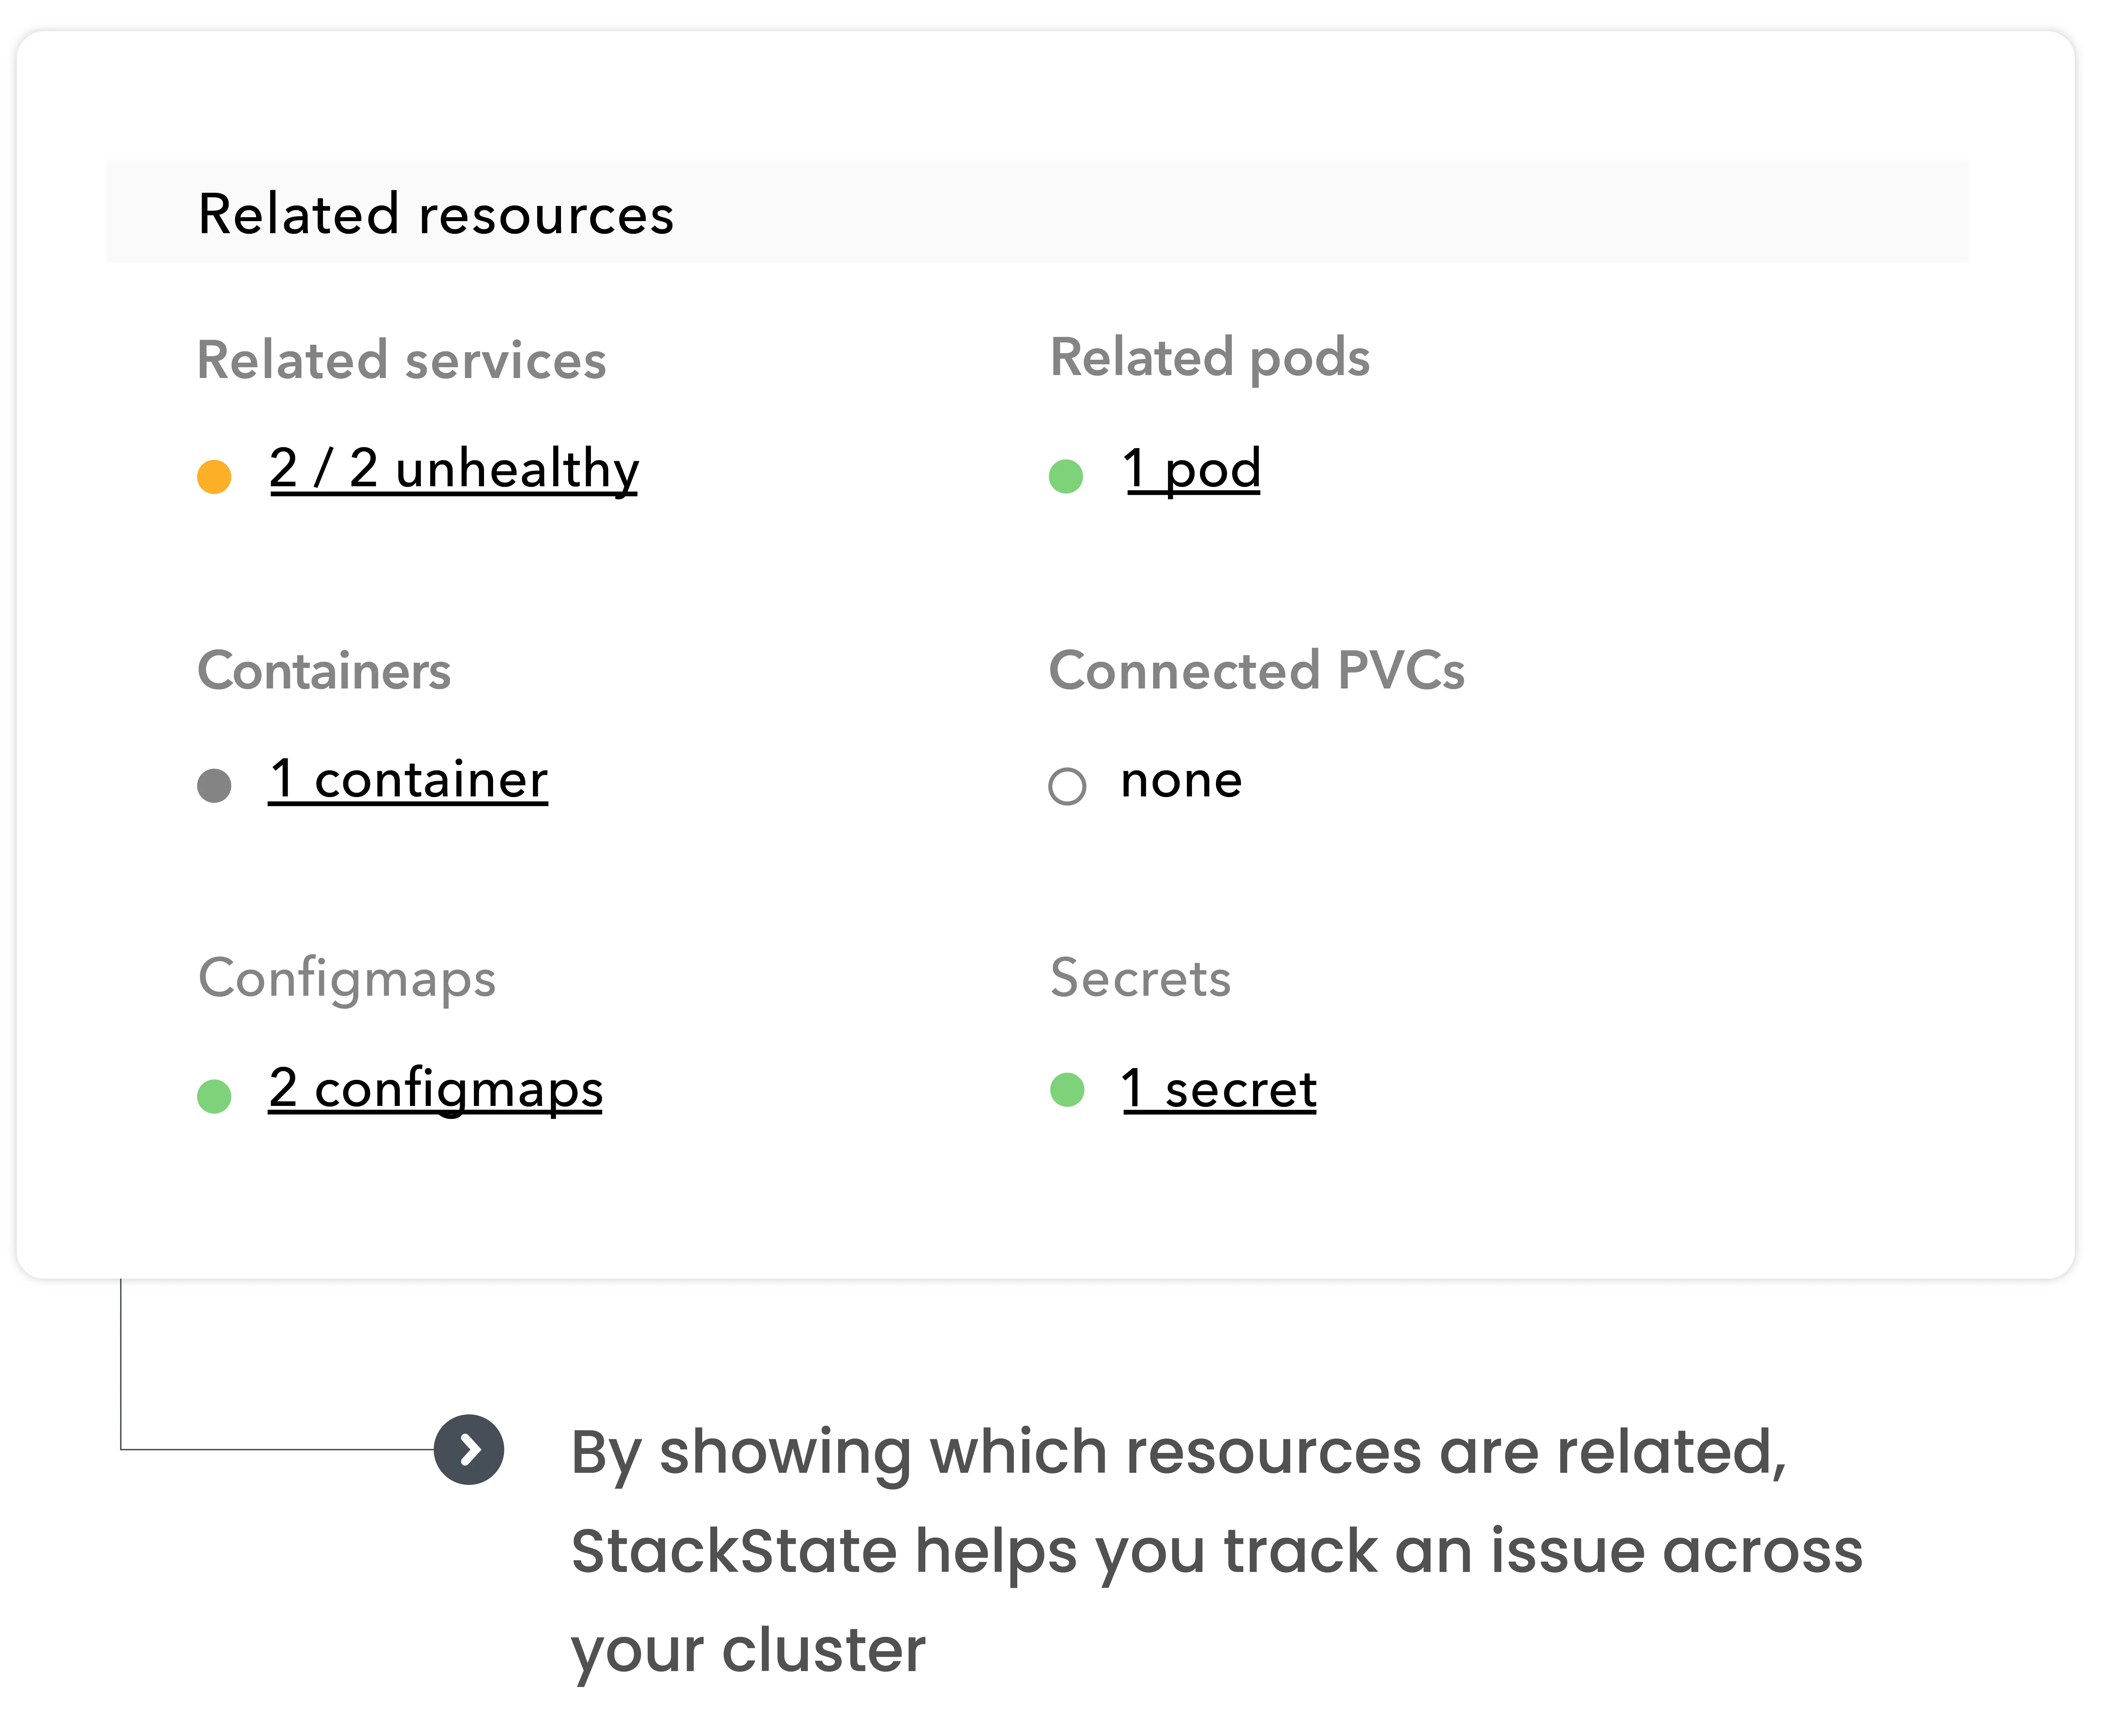


Seamlessly navigate between monitors, alerts, resources, metrics, logs, traces and services
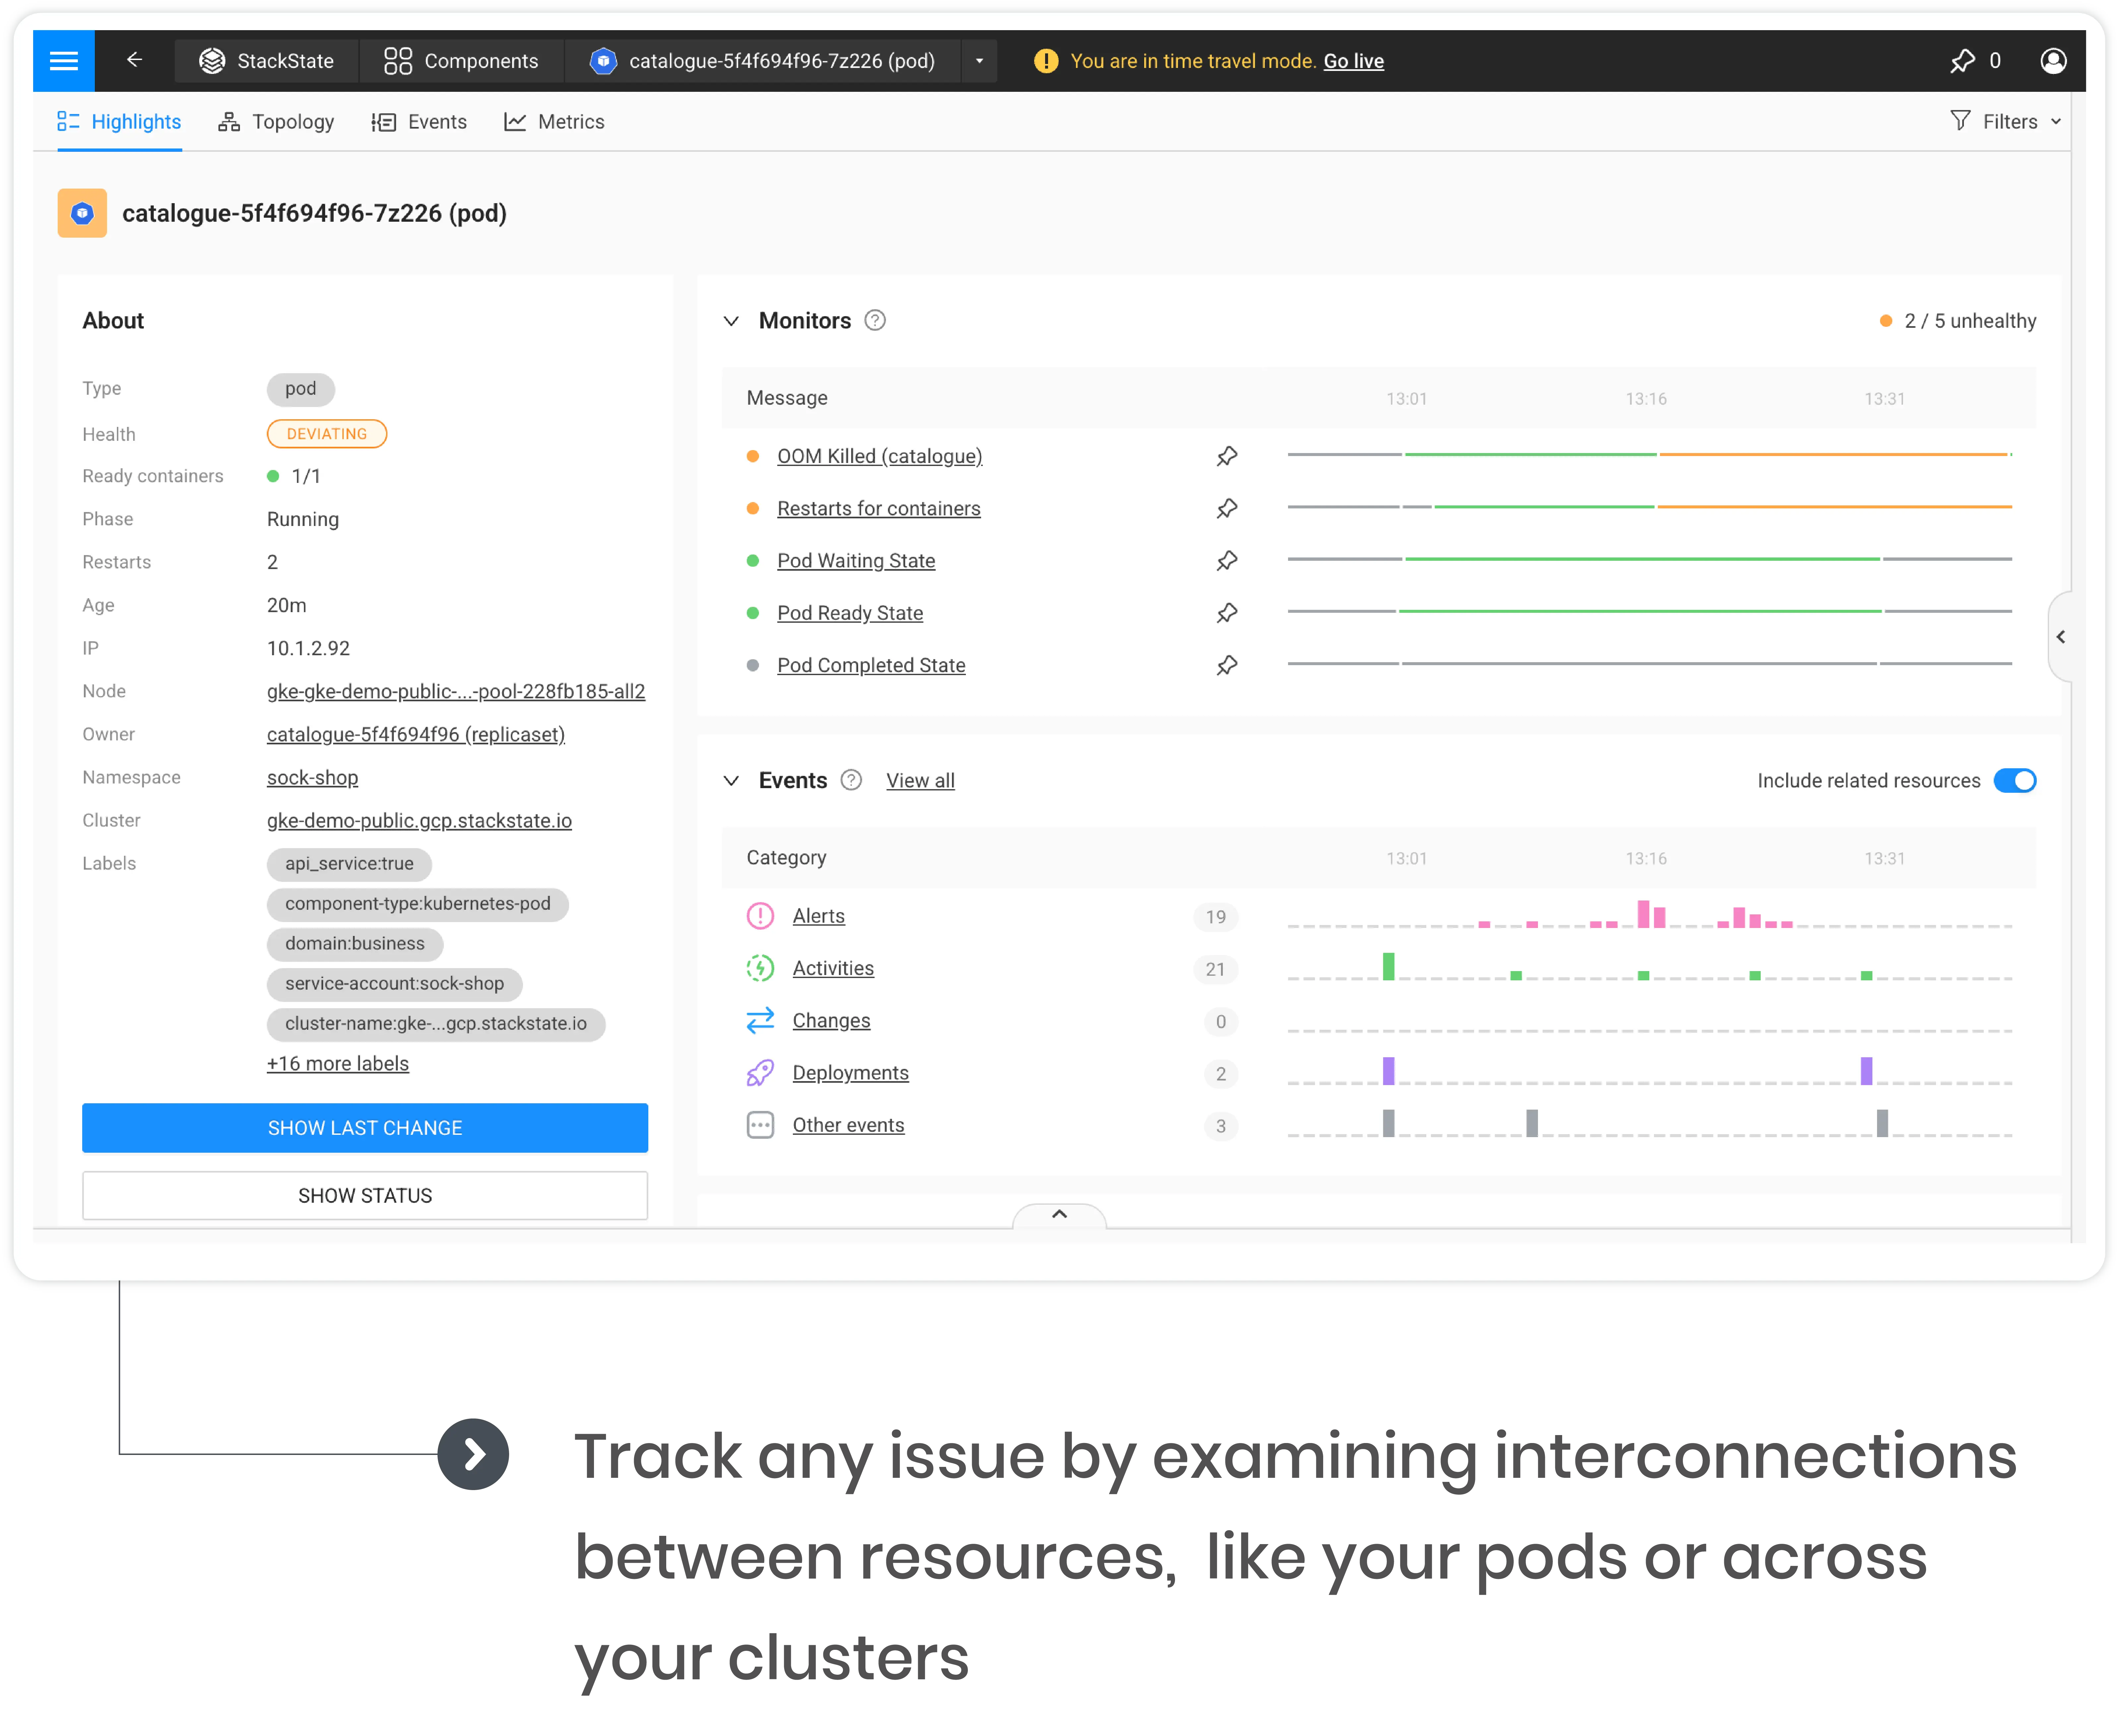
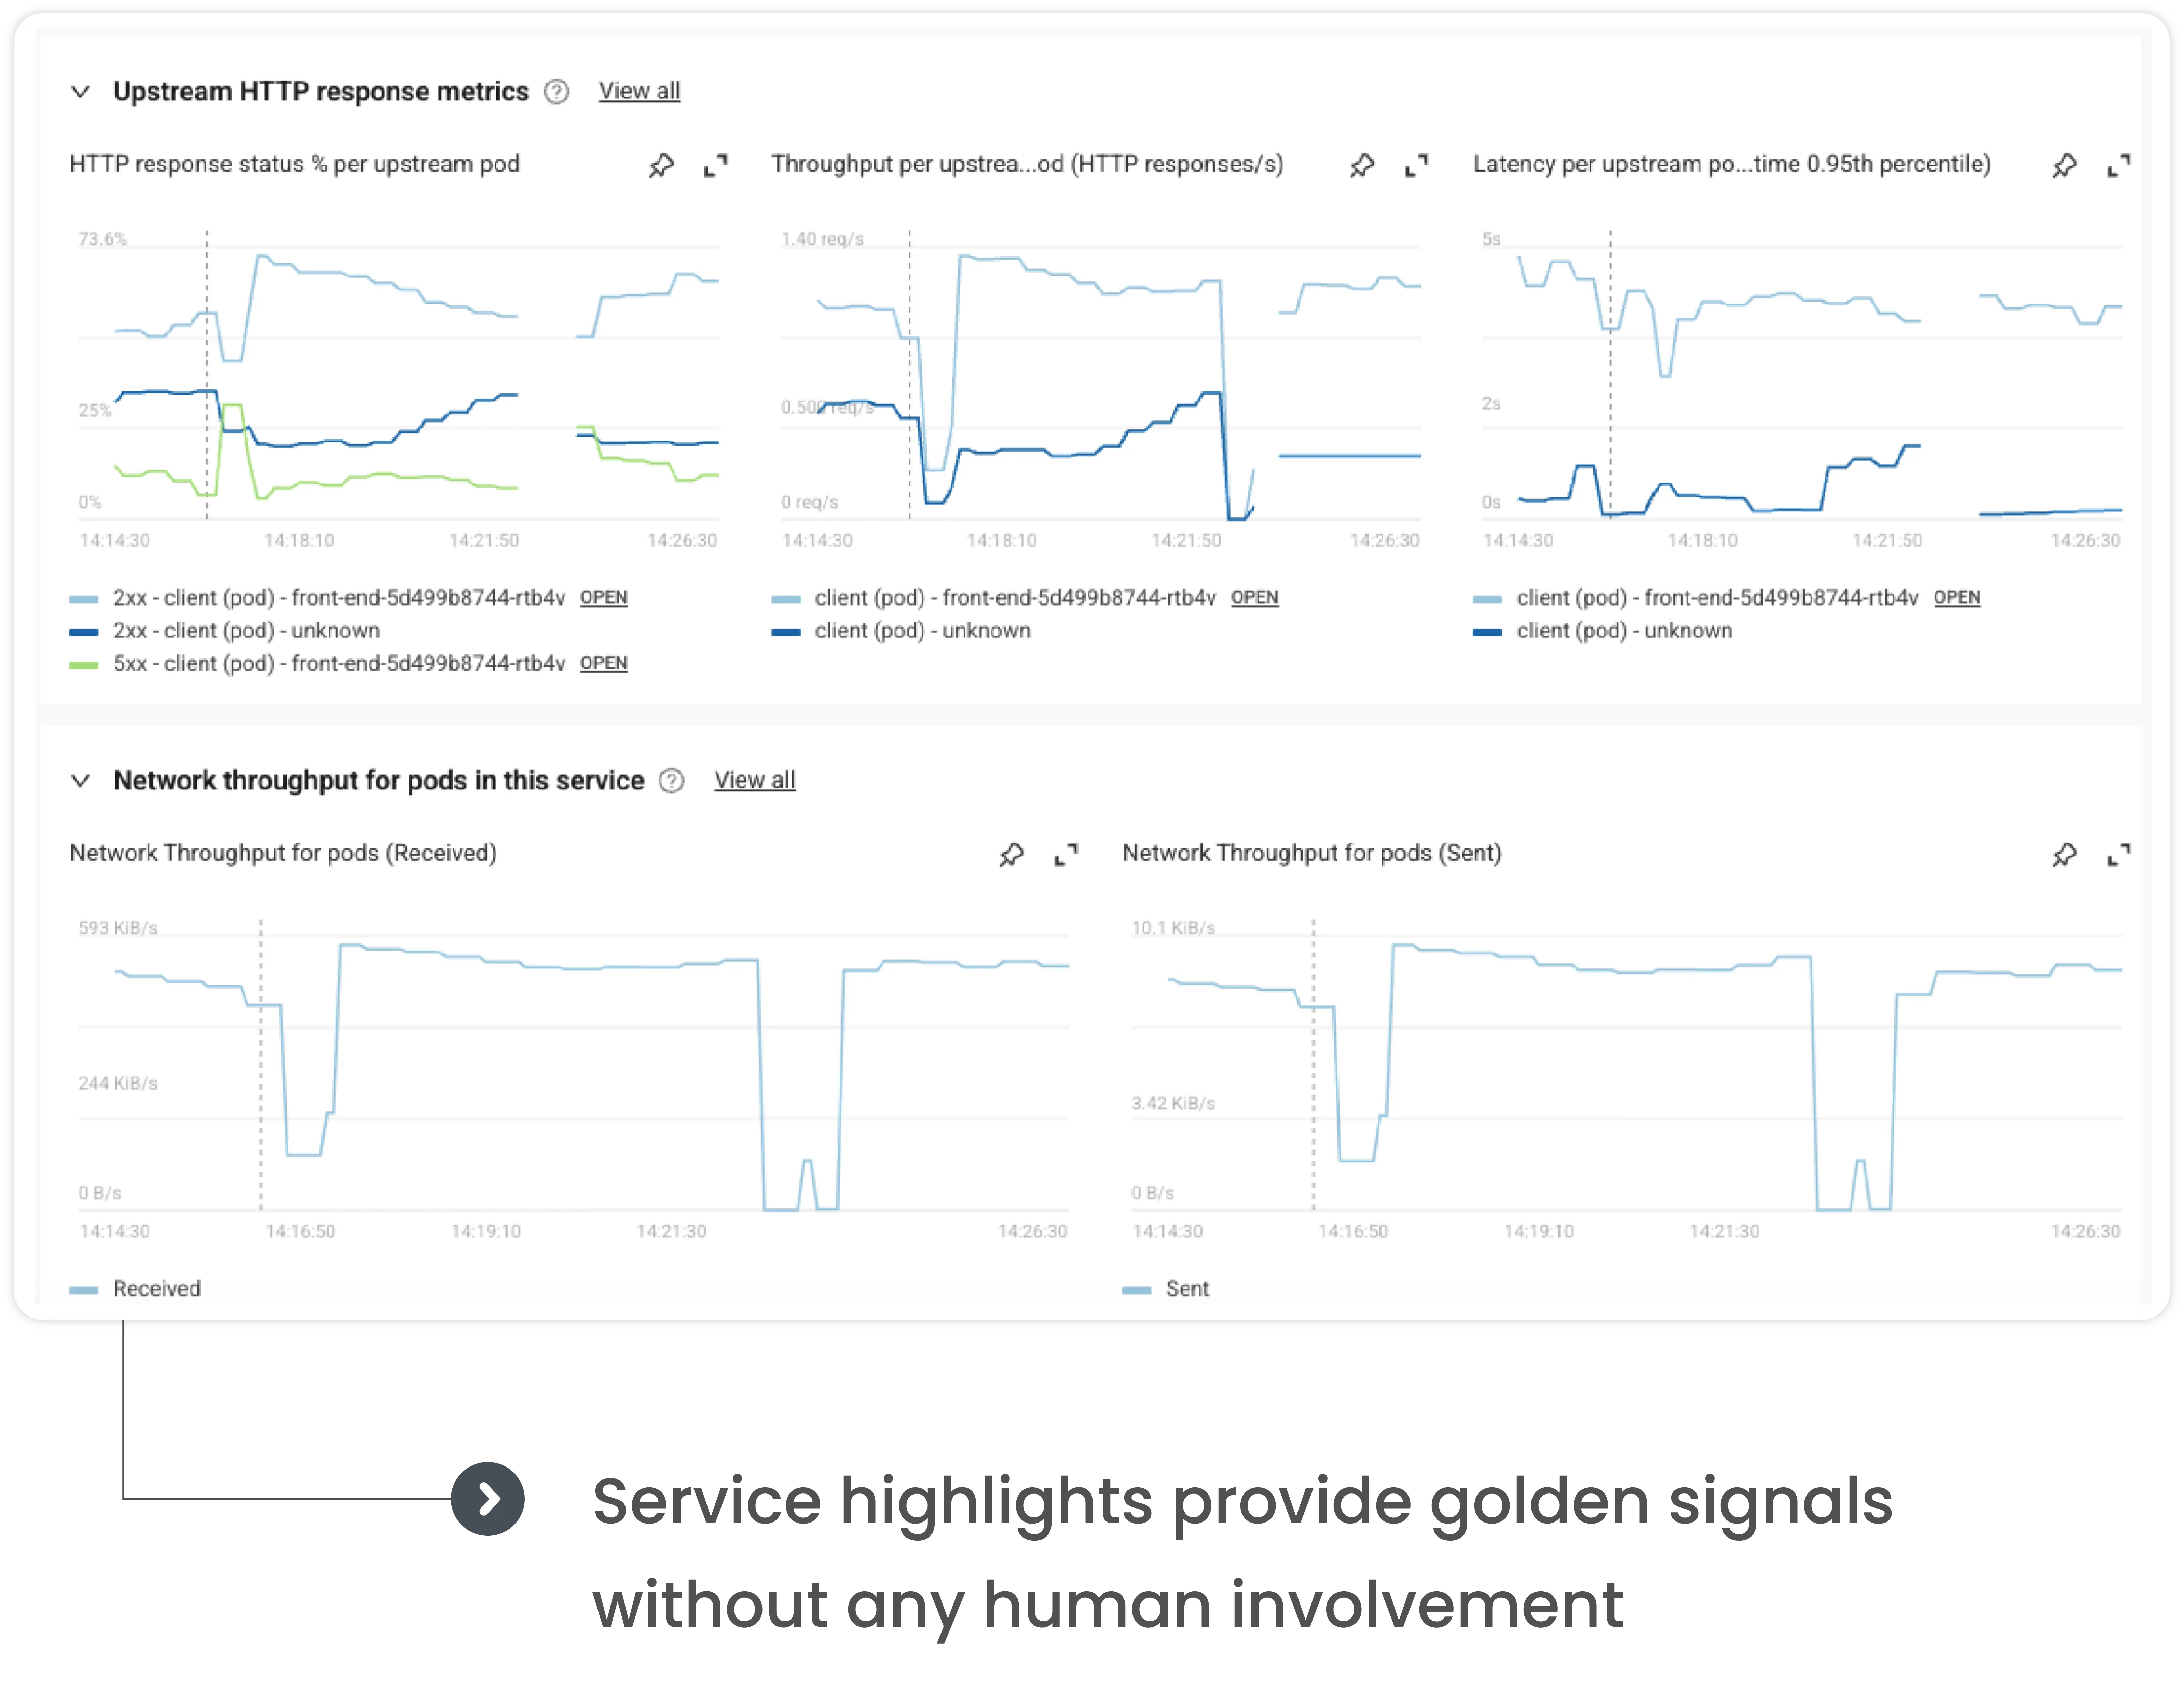
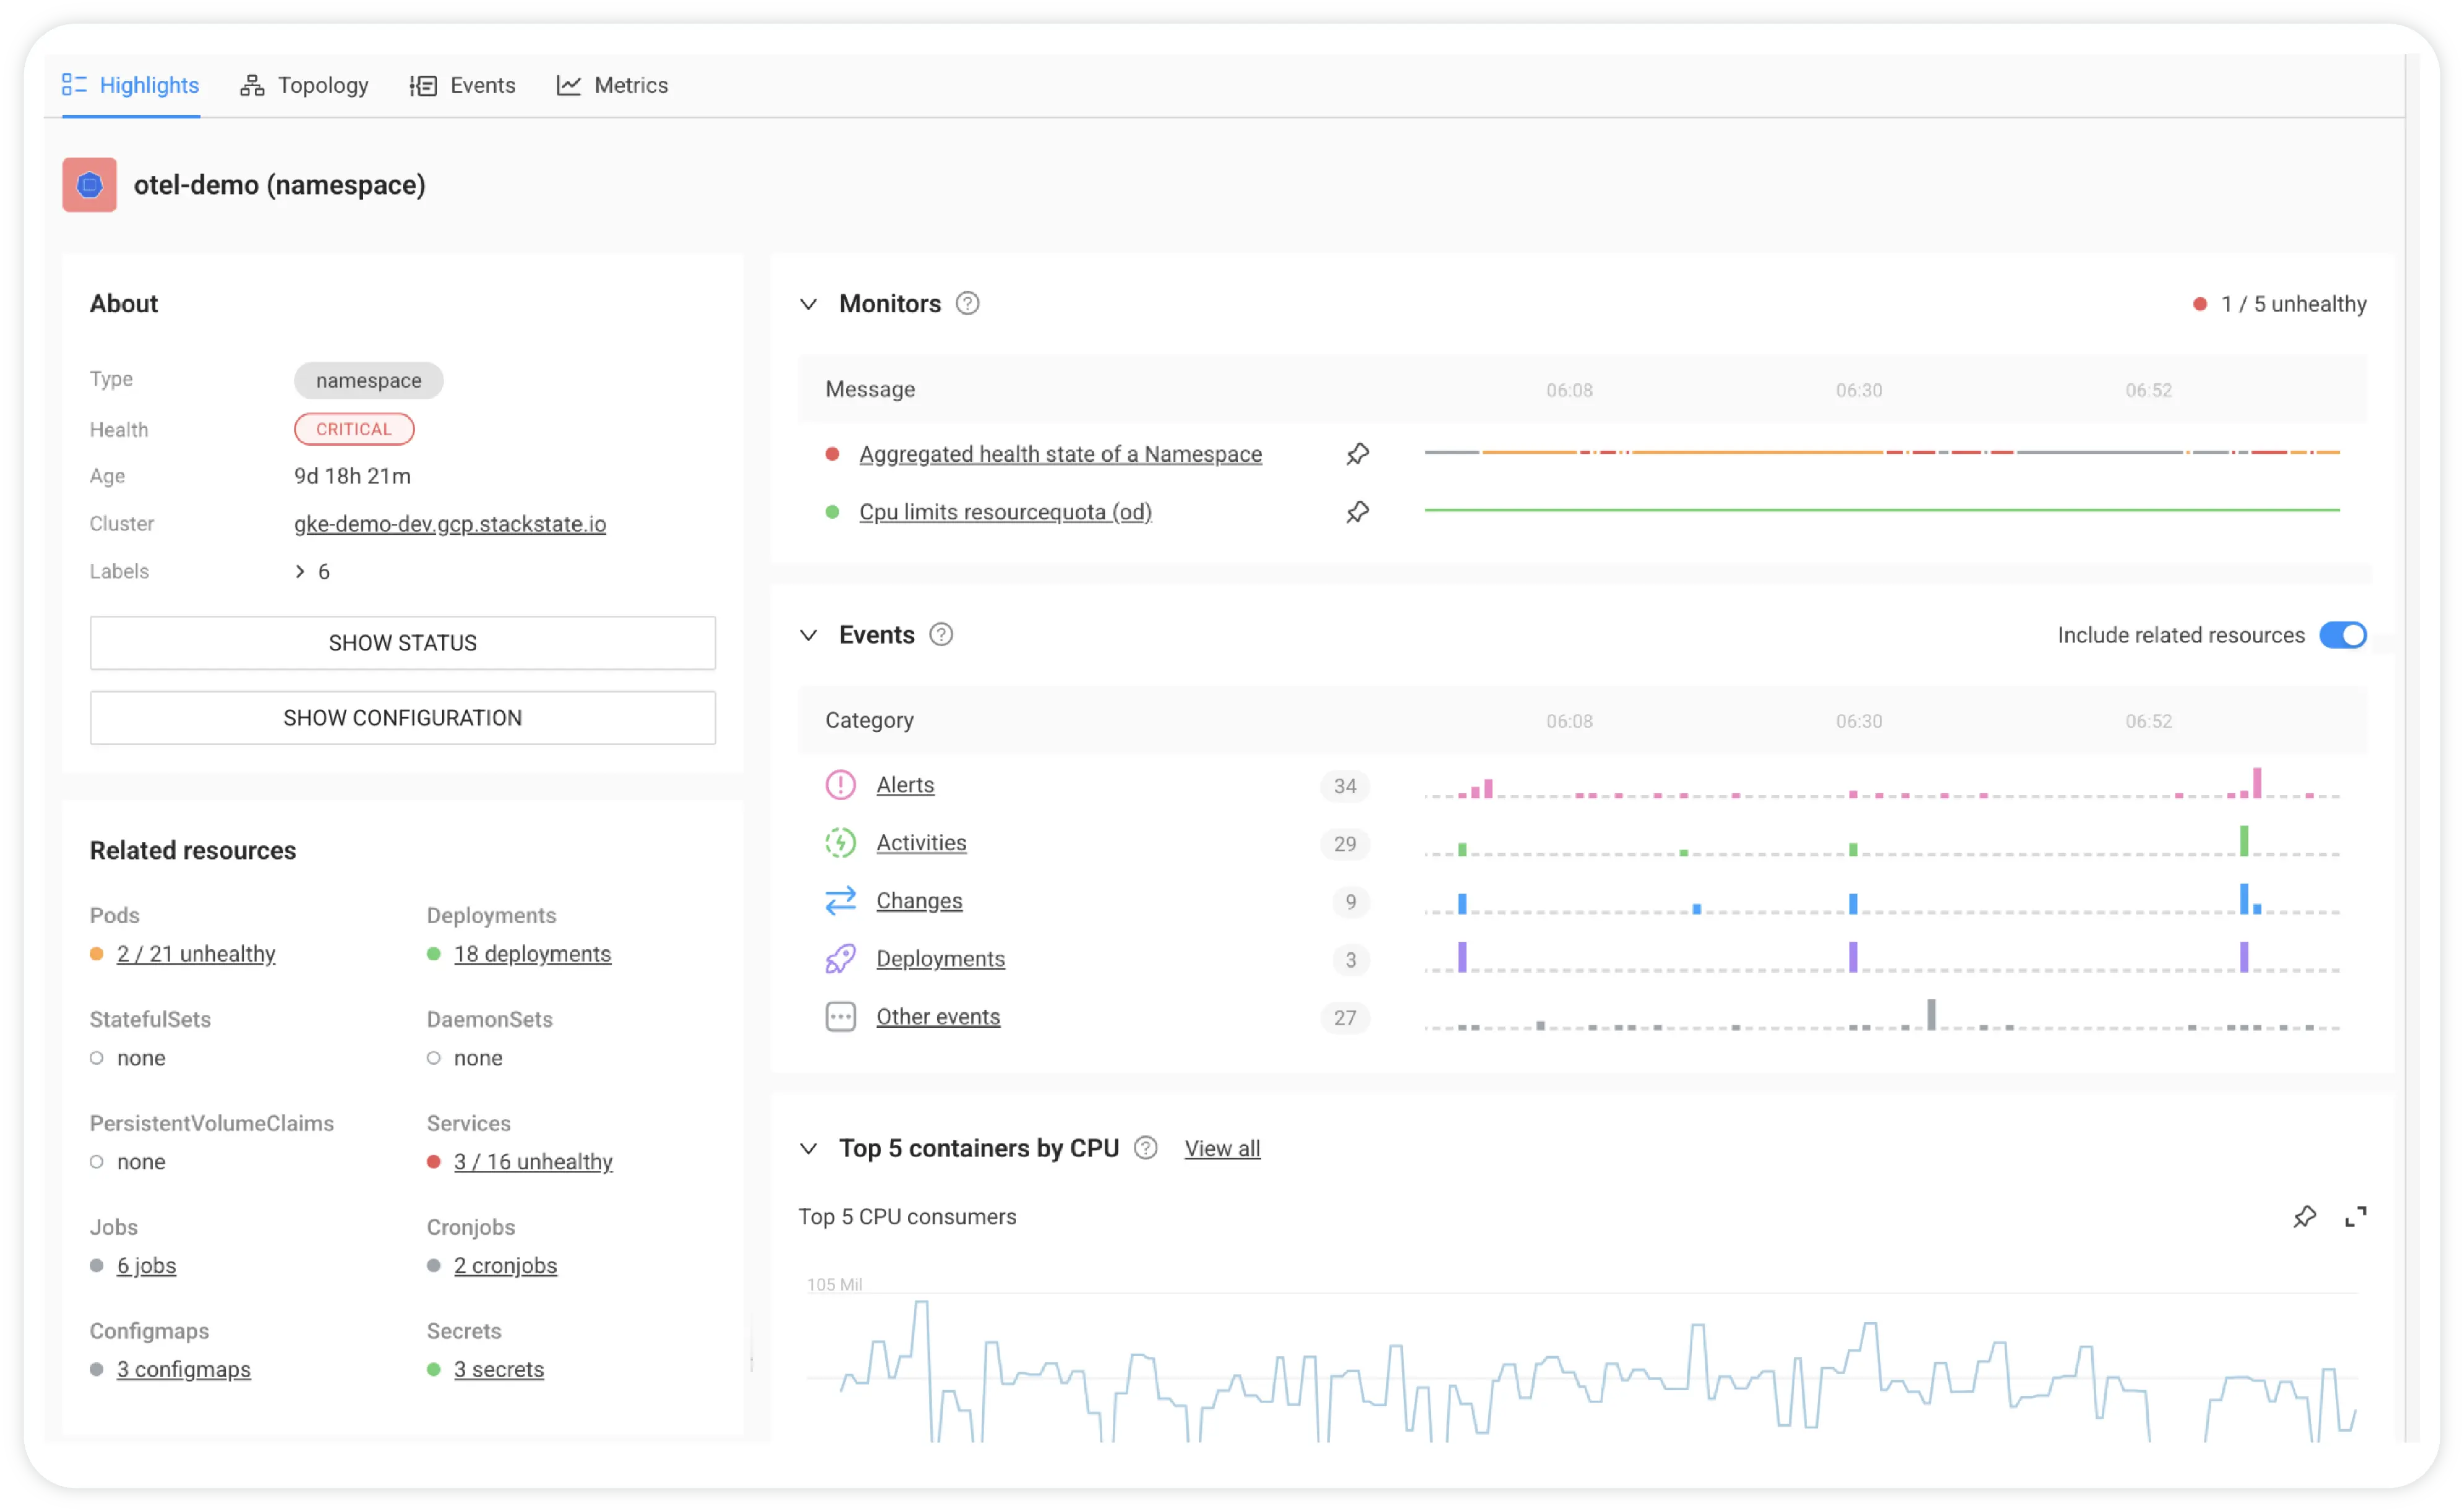
Spotlight the most important metrics and all relevant events for each resource type
Instantly understand the status and configuration of each component
Click-to-view the “last change” and golden signals (error rate, throughput, and latency)
Monitor component and resource health for informed decision-making
Effortlessly access essential metadata like labels, age, owner, namespace, and cluster information