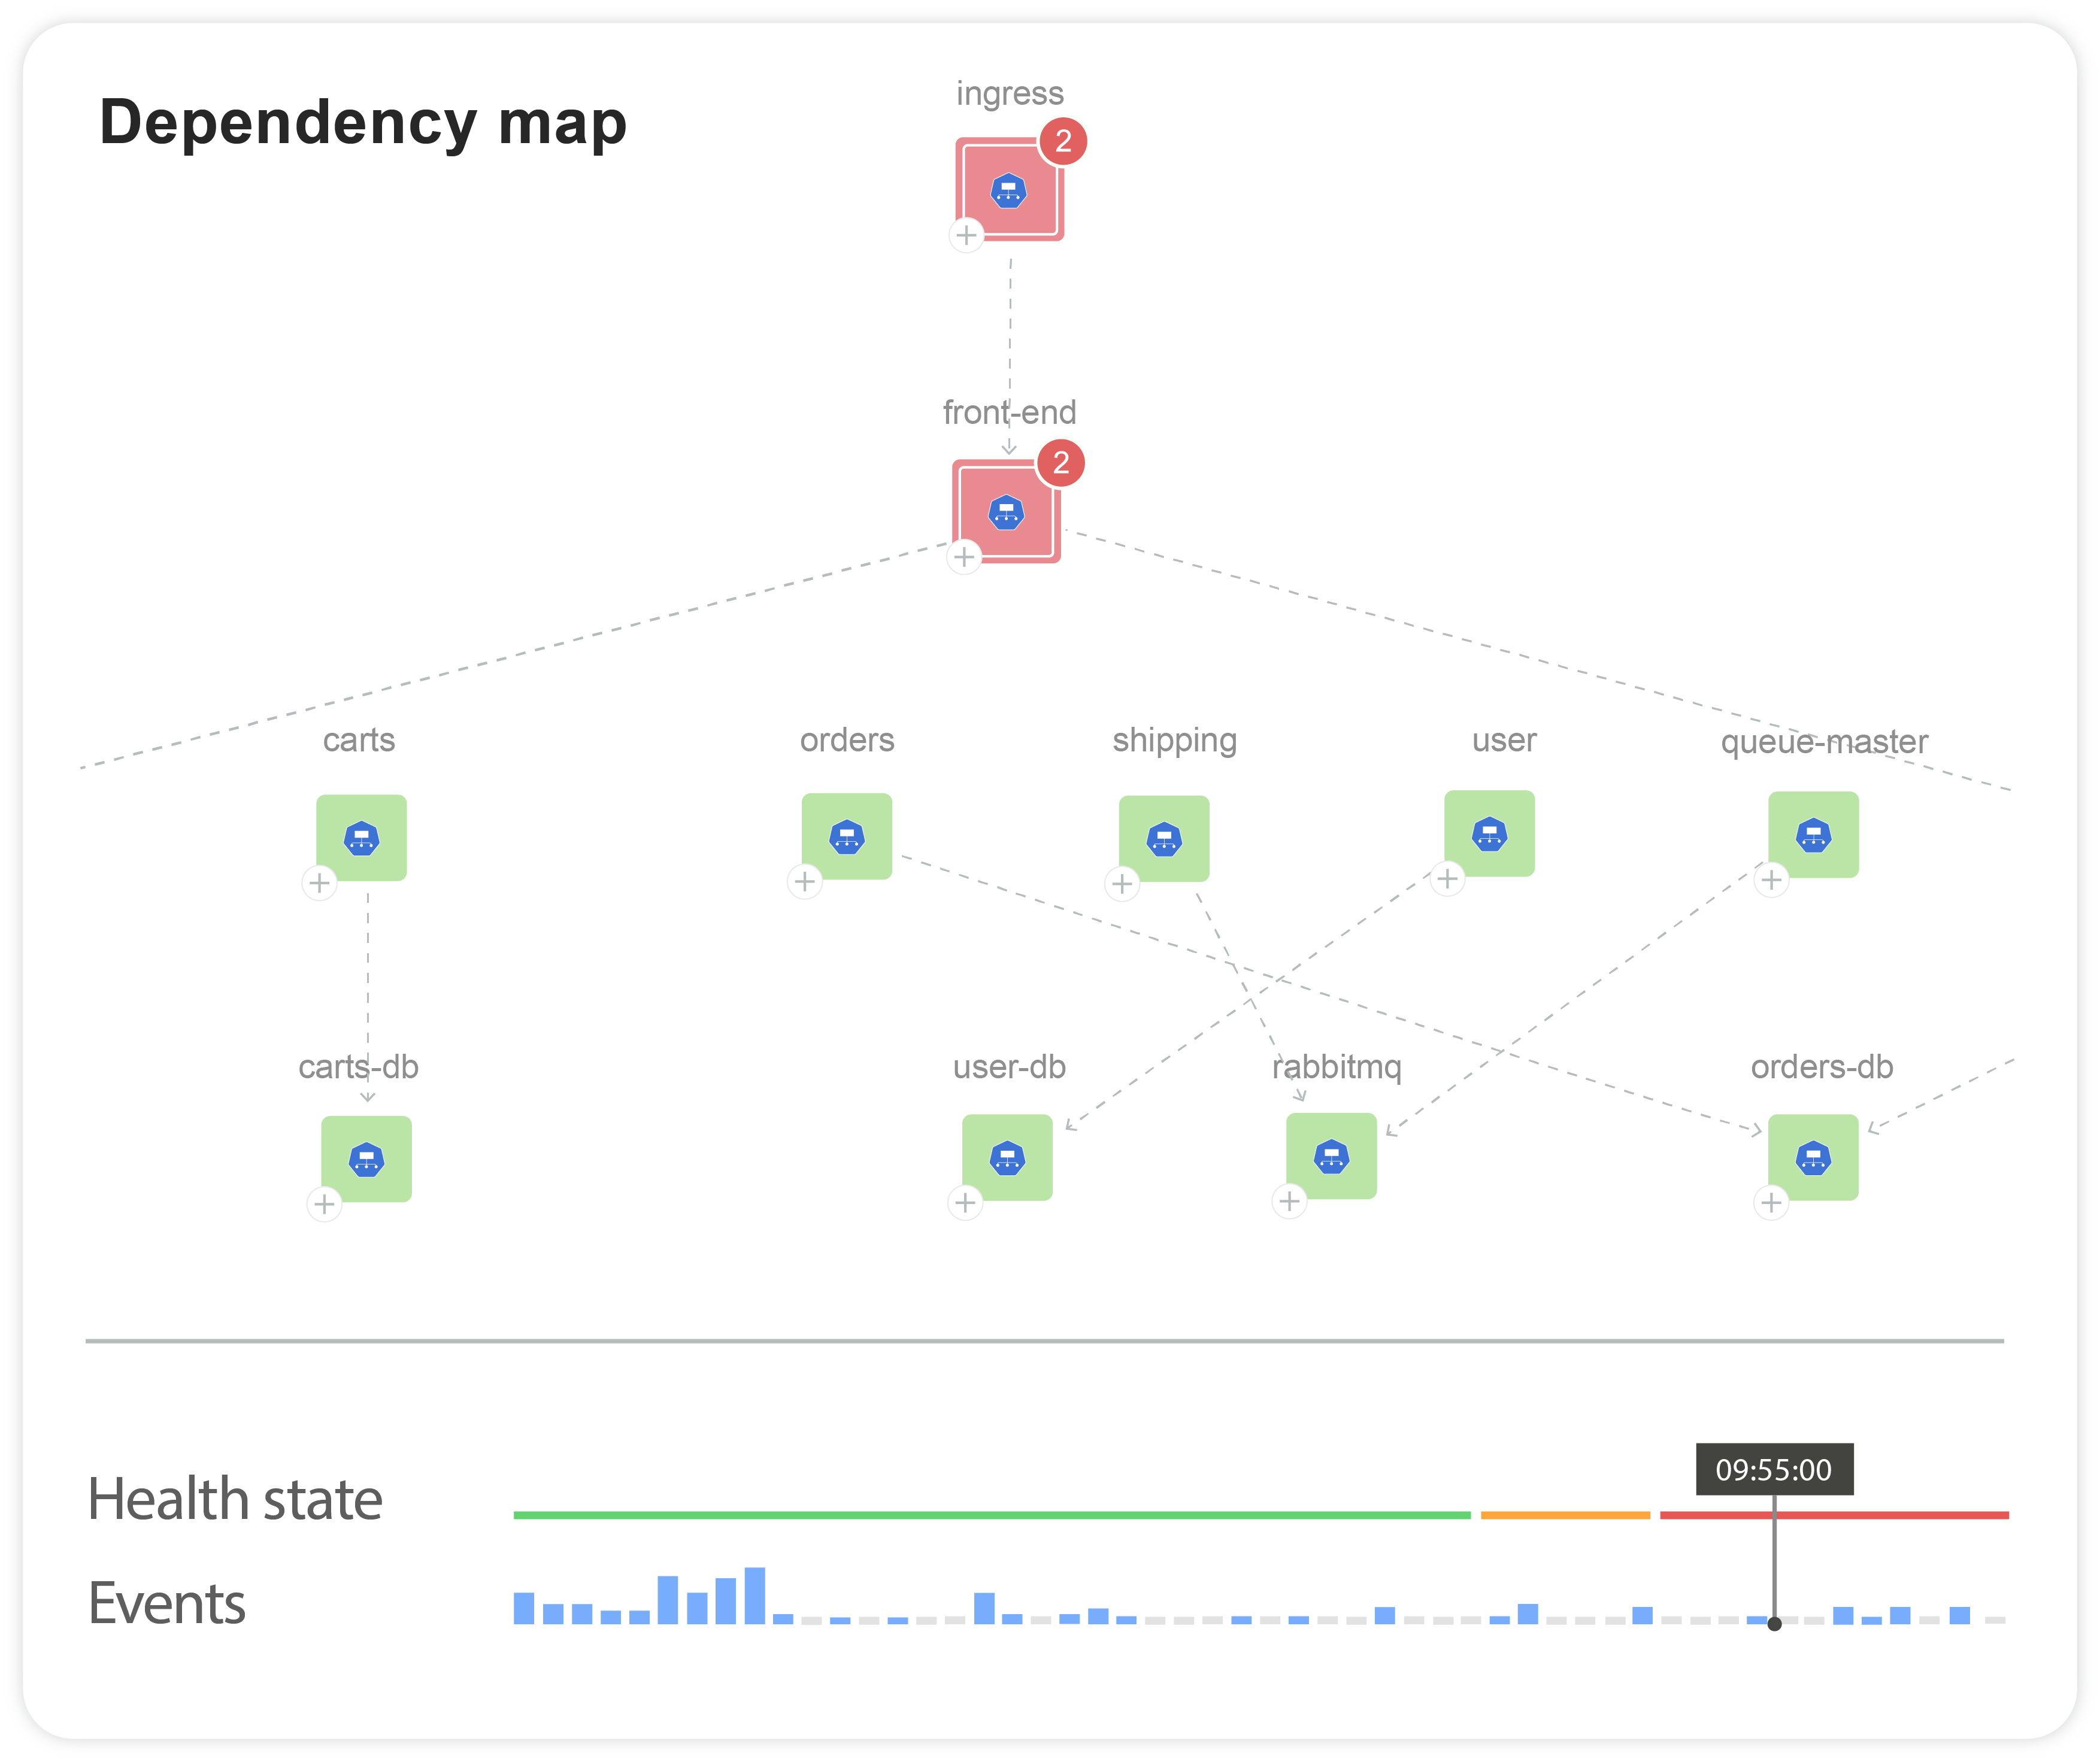
Timeline snapshots show cluster and issue evolution over time
User-friendly navigation highlights key info and enables easy exploration
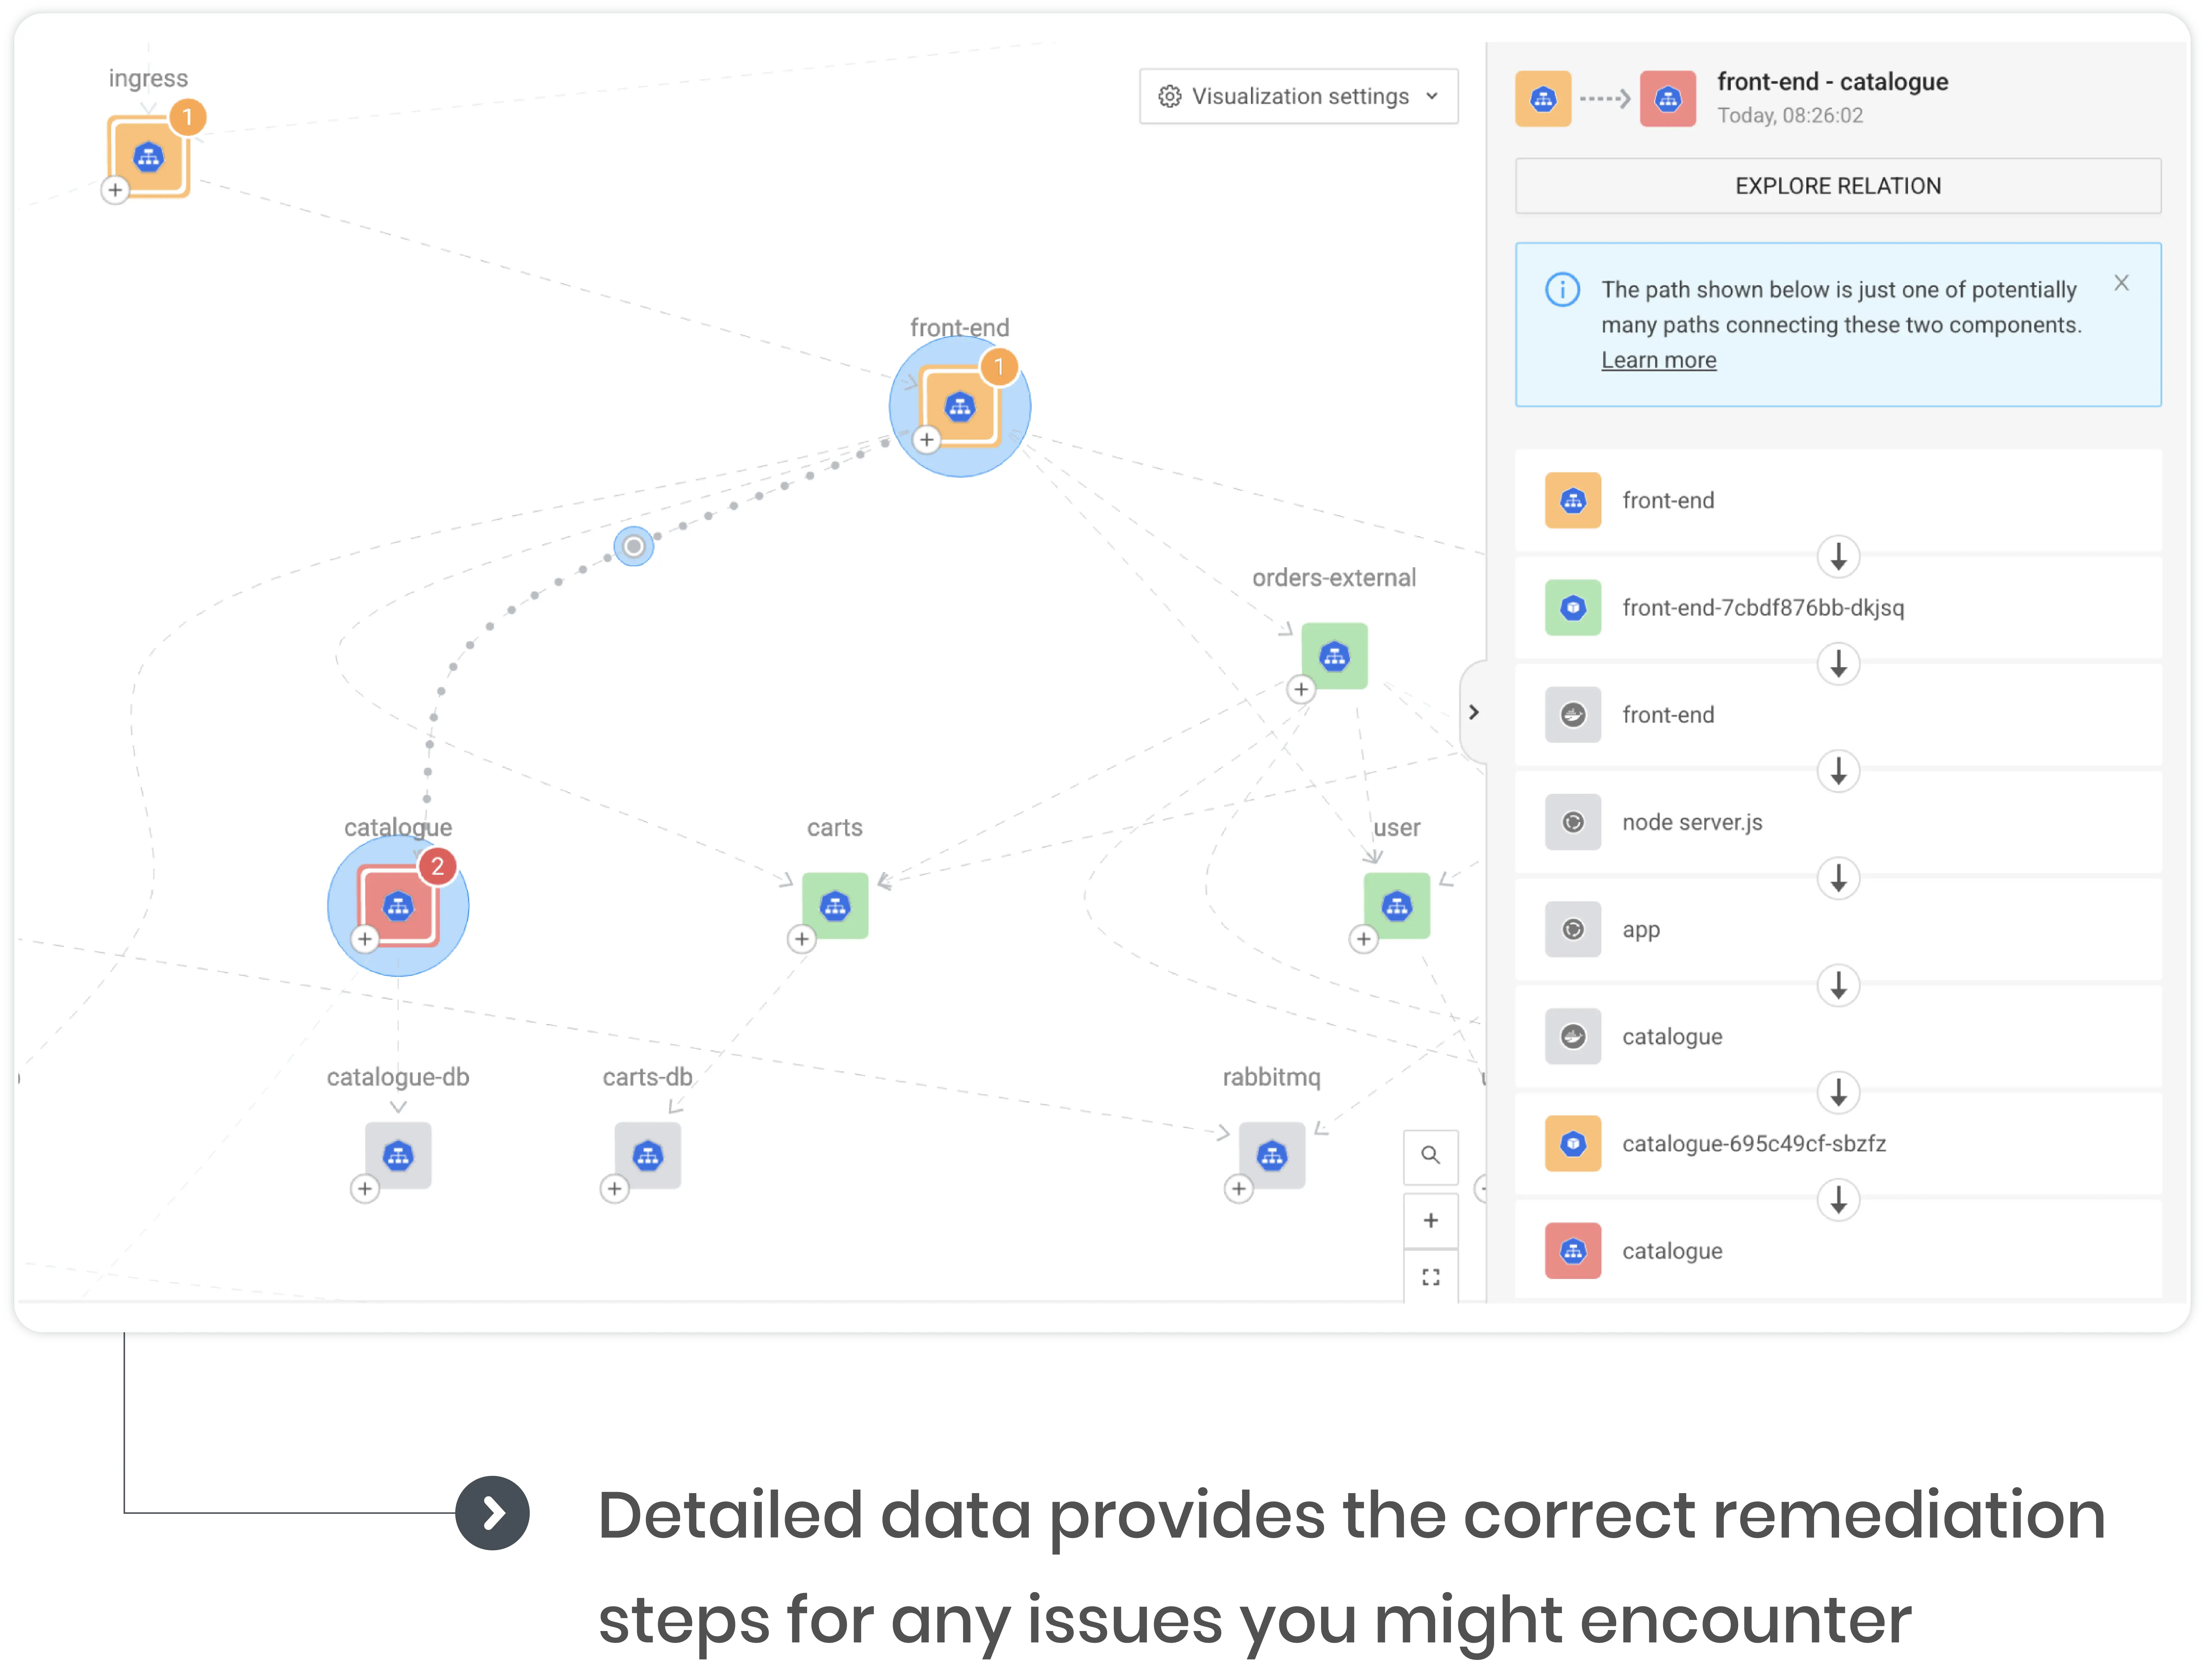
Display indirect relationships, including all between-service hops
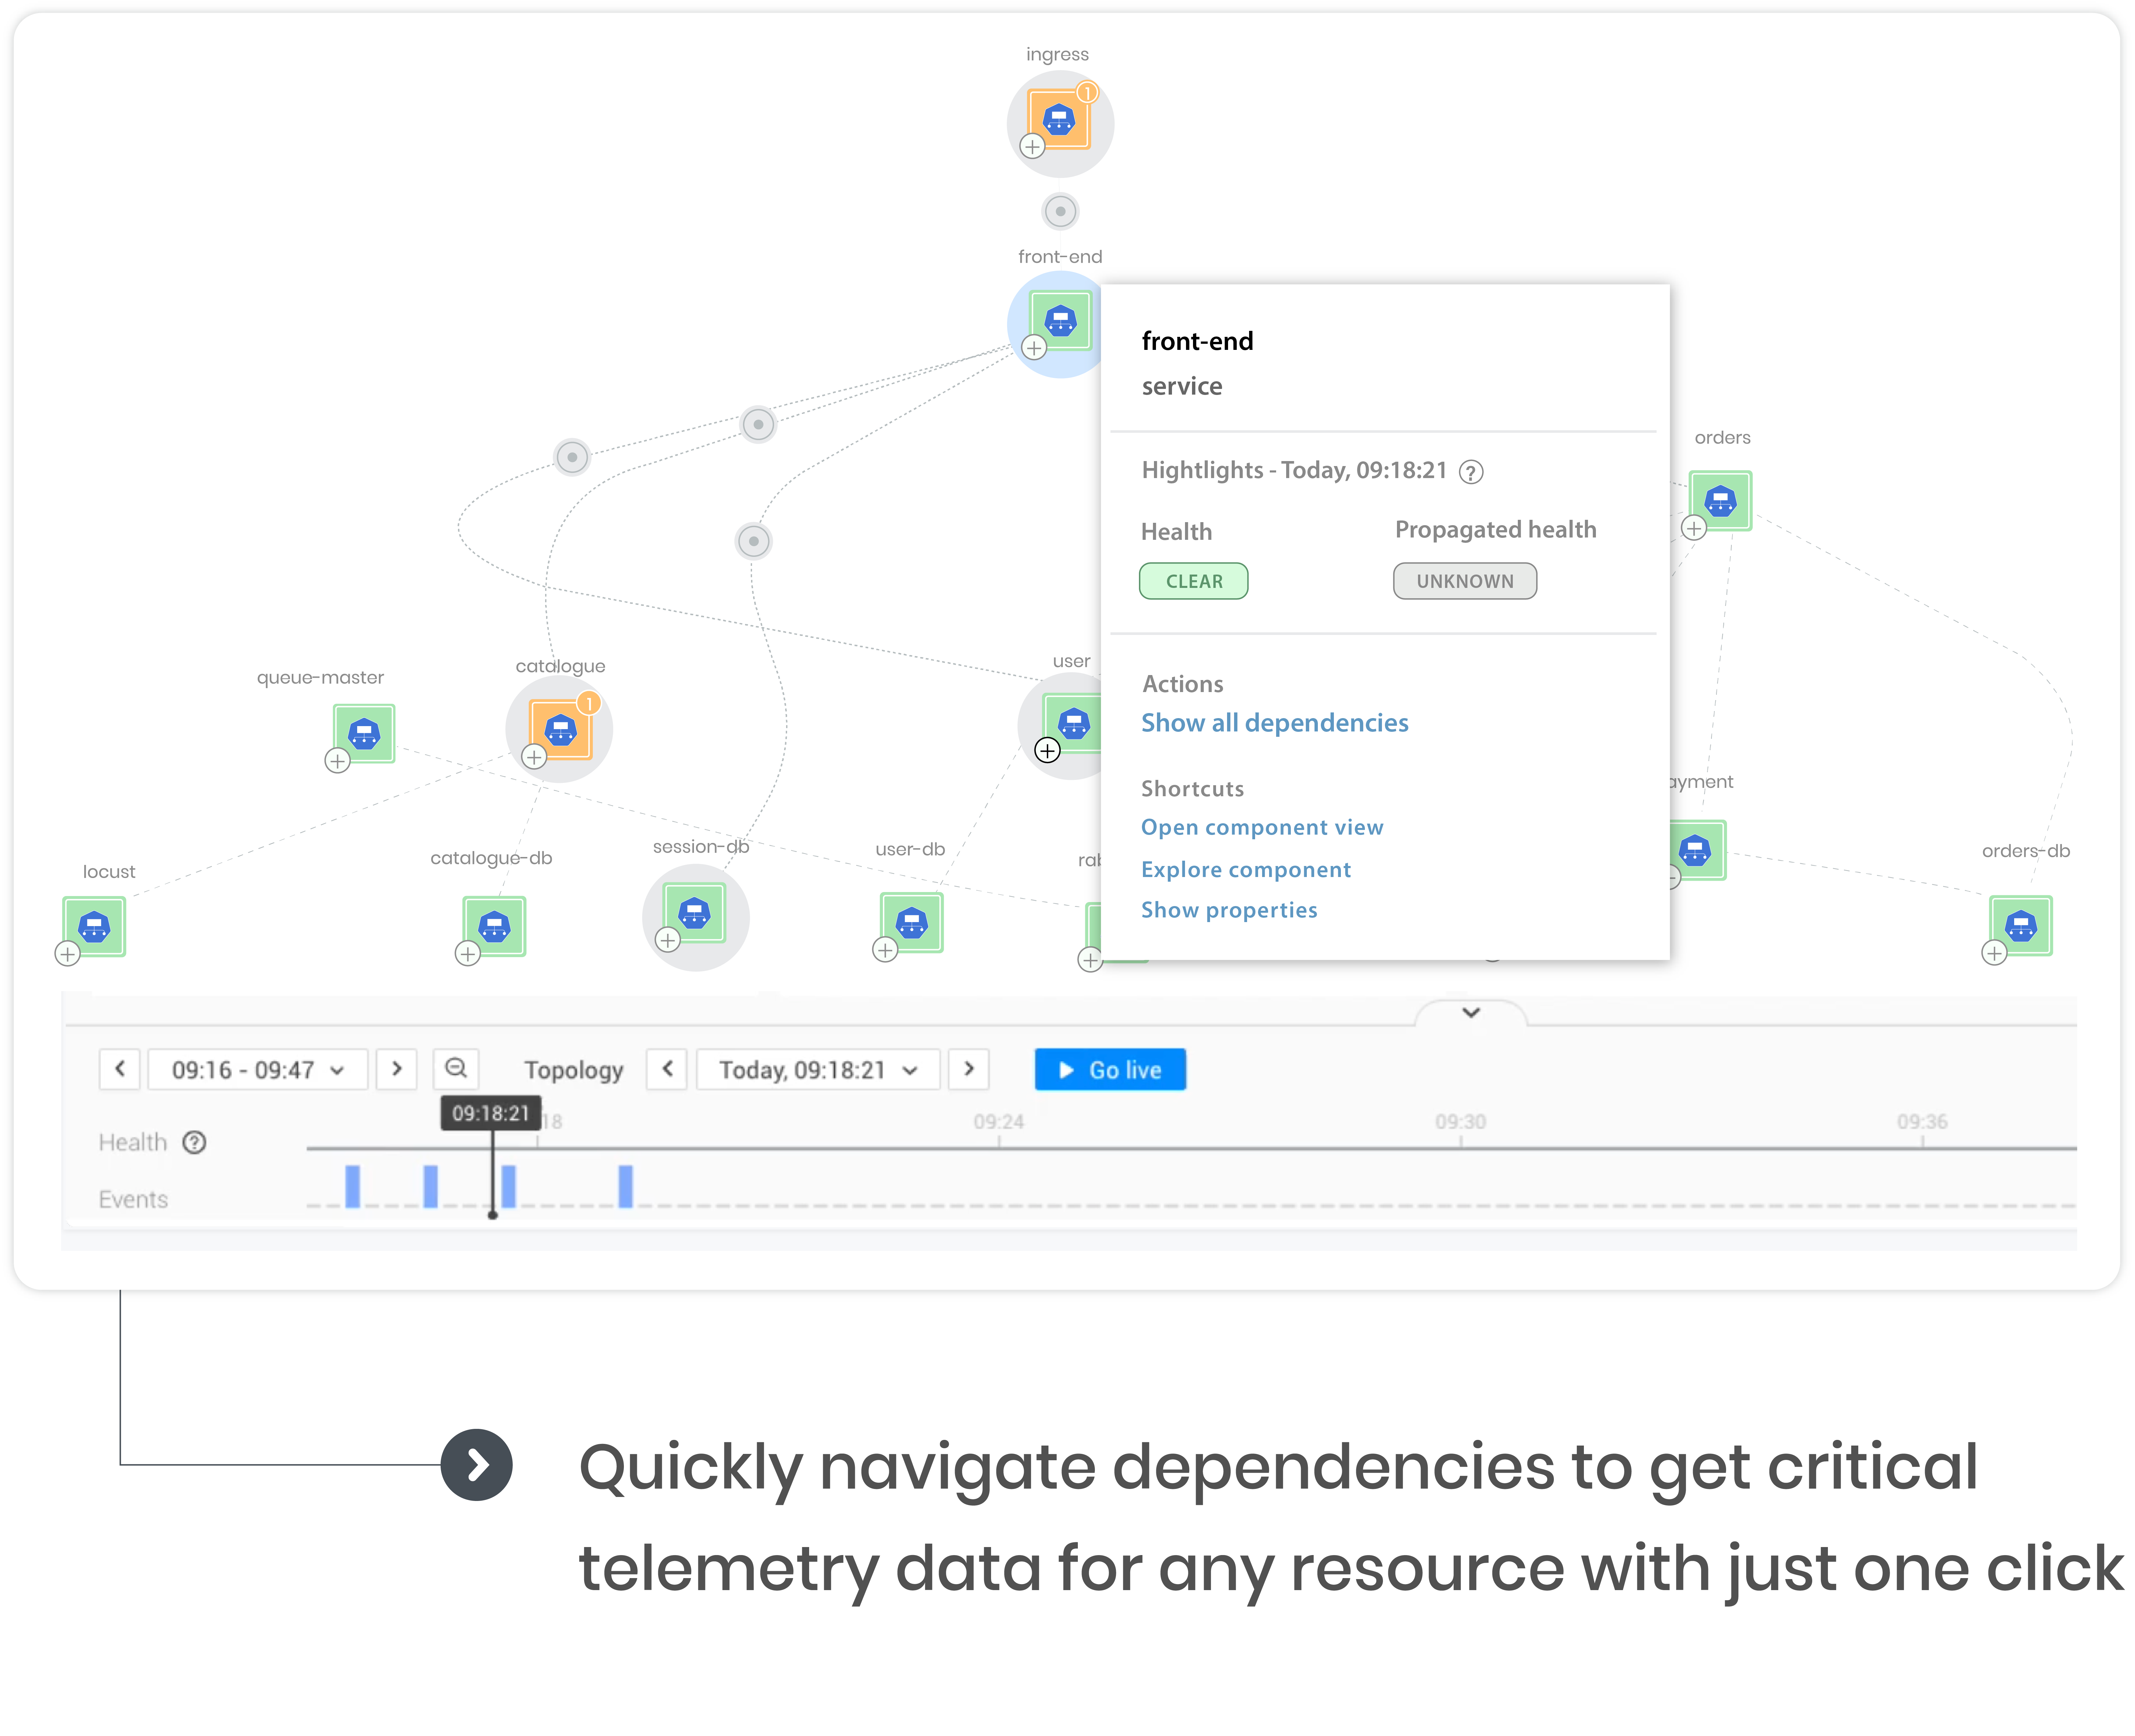
Navigate resource dependencies and critical telemetry with a single click
Automated dependency tracking eliminates the need for additional architecture knowledge
Efficient eBPF integration ensures programming language independence
Get a holistic and topological view of your entire IT stack
StackState’s Dependency Maps automatically identify and display service dependencies, helping you understand complex relationships, track resource changes, and monitor performance for quicker issue resolution.
Advanced mapping exposes hidden layers and weak links to aid issue diagnosis and performance optimization
Discover what makes your apps tick
Uncover what’s keeping them from functioning at 100%.
StackState’s dynamically generated, full-stack dependency maps provide DevOps teams with out-of-the-box visibility into service interactions, downstream dependencies, related infrastructure, and performance — even for resources you might not directly manage. Whether you're a seasoned expert or new to the role, you’ll instantly grasp the intricacies of your apps.
Navigating these service and infrastructure maps is simple and easy, thanks to real-time topology enhancements that show dependencies between all components at any moment in time. With the increased insight provided by our Dependency Maps, software engineers of all disciplines can improve their troubleshooting skills, save time, and solve problems independently — avoiding unnecessary company-wide fire drills.
Go ahead, ask the tough questions
Real-time topology is the key to providing answers quickly.
StackState dependency maps outshine basic service maps in scope and granularity with the unique ability to illustrate how dependencies and issues progress at any time — and over time. Leveraging our real-time topology, you can isolate services to inspect interrelationships, search and filter for specific selections, and drill down into the related resources and their dynamic dashboards.
With observability extending beyond pre-packaged insights, you'll uncover what truly drives your apps, enabling you to determine details like which pods host your shopping cart and why the checkout is experiencing high latency. Plus, there's no waiting to crunch lots of data to update maps — navigation is lightning-fast.
Immediate insights into business impact and root causes
Lead teams on the fastest path to remediation.
SREs and platform leaders can now empower teams with independent and efficient issue management straight out of the box. With just a few clicks, StackState users gain quick access to critical information through an intricate visual graph covering all aspects of the system — from service-to-service communication to the management of volumes, pods, and deployments. This proactive approach helps avoid potential problems and bottlenecks.
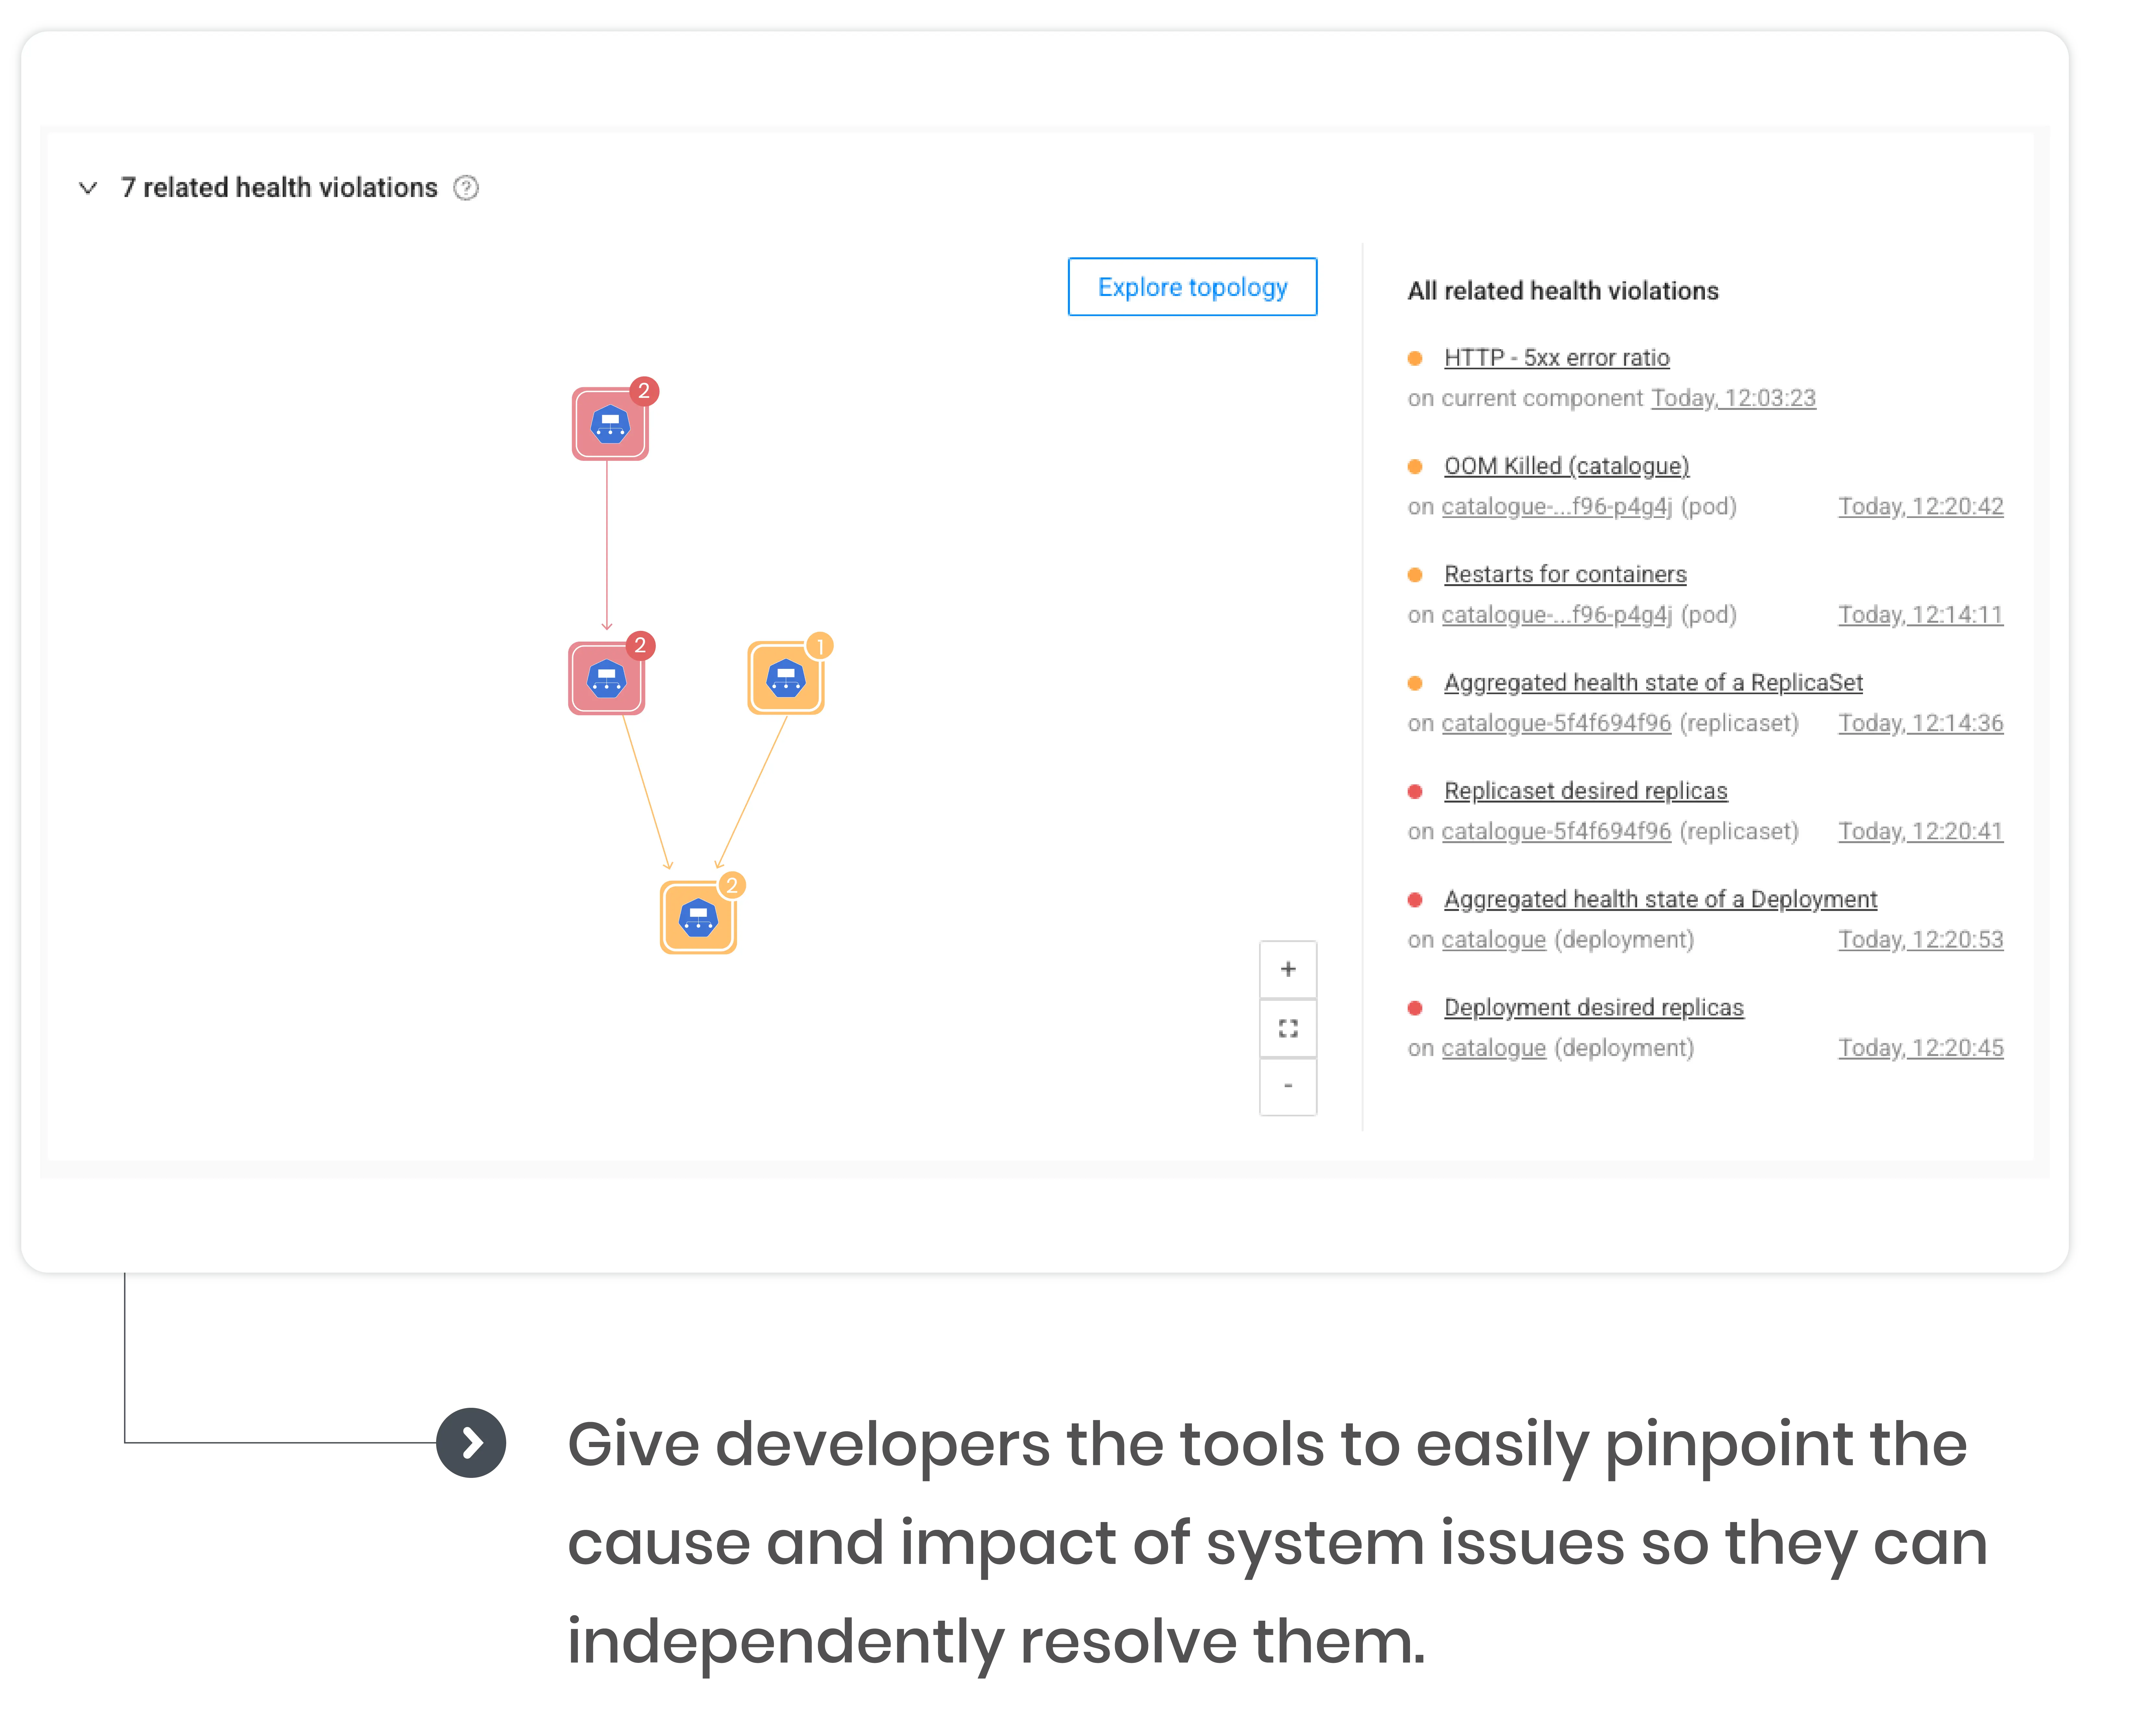
During outages, however, you don’t want a complex analysis of system relationships. You need direct insights into the issue’s root cause and its immediate impact. Here, StackState leverages the graph to provide instant clarity of associated health violations, allowing teams to focus on resolution, not research, ensuring minimal disruption and maximum efficiency.
Find issues and fix them fast with better observability
StackState’s Dependency Maps streamline troubleshooting, allowing for easy problem pinpointing in complex systems and quick and effective issue resolution on the first try, thanks to our expert knowledge base. This is just a glimpse of how a full stack observability platform contributes to scaling services, enhancing performance, and ensuring application reliability.
Want to learn how StackState can empower your teams?
Open, extensible, and easily integrates with all major cloud platforms and solutions
SOC 2 compliant • Low eBPF overhead • OpenTelemetry-native