A unified, holistic view highlights complex dependencies and facilitates and promotes improved system performance
No more manual switching between multiple tools to get a comprehensive picture of your telemetry
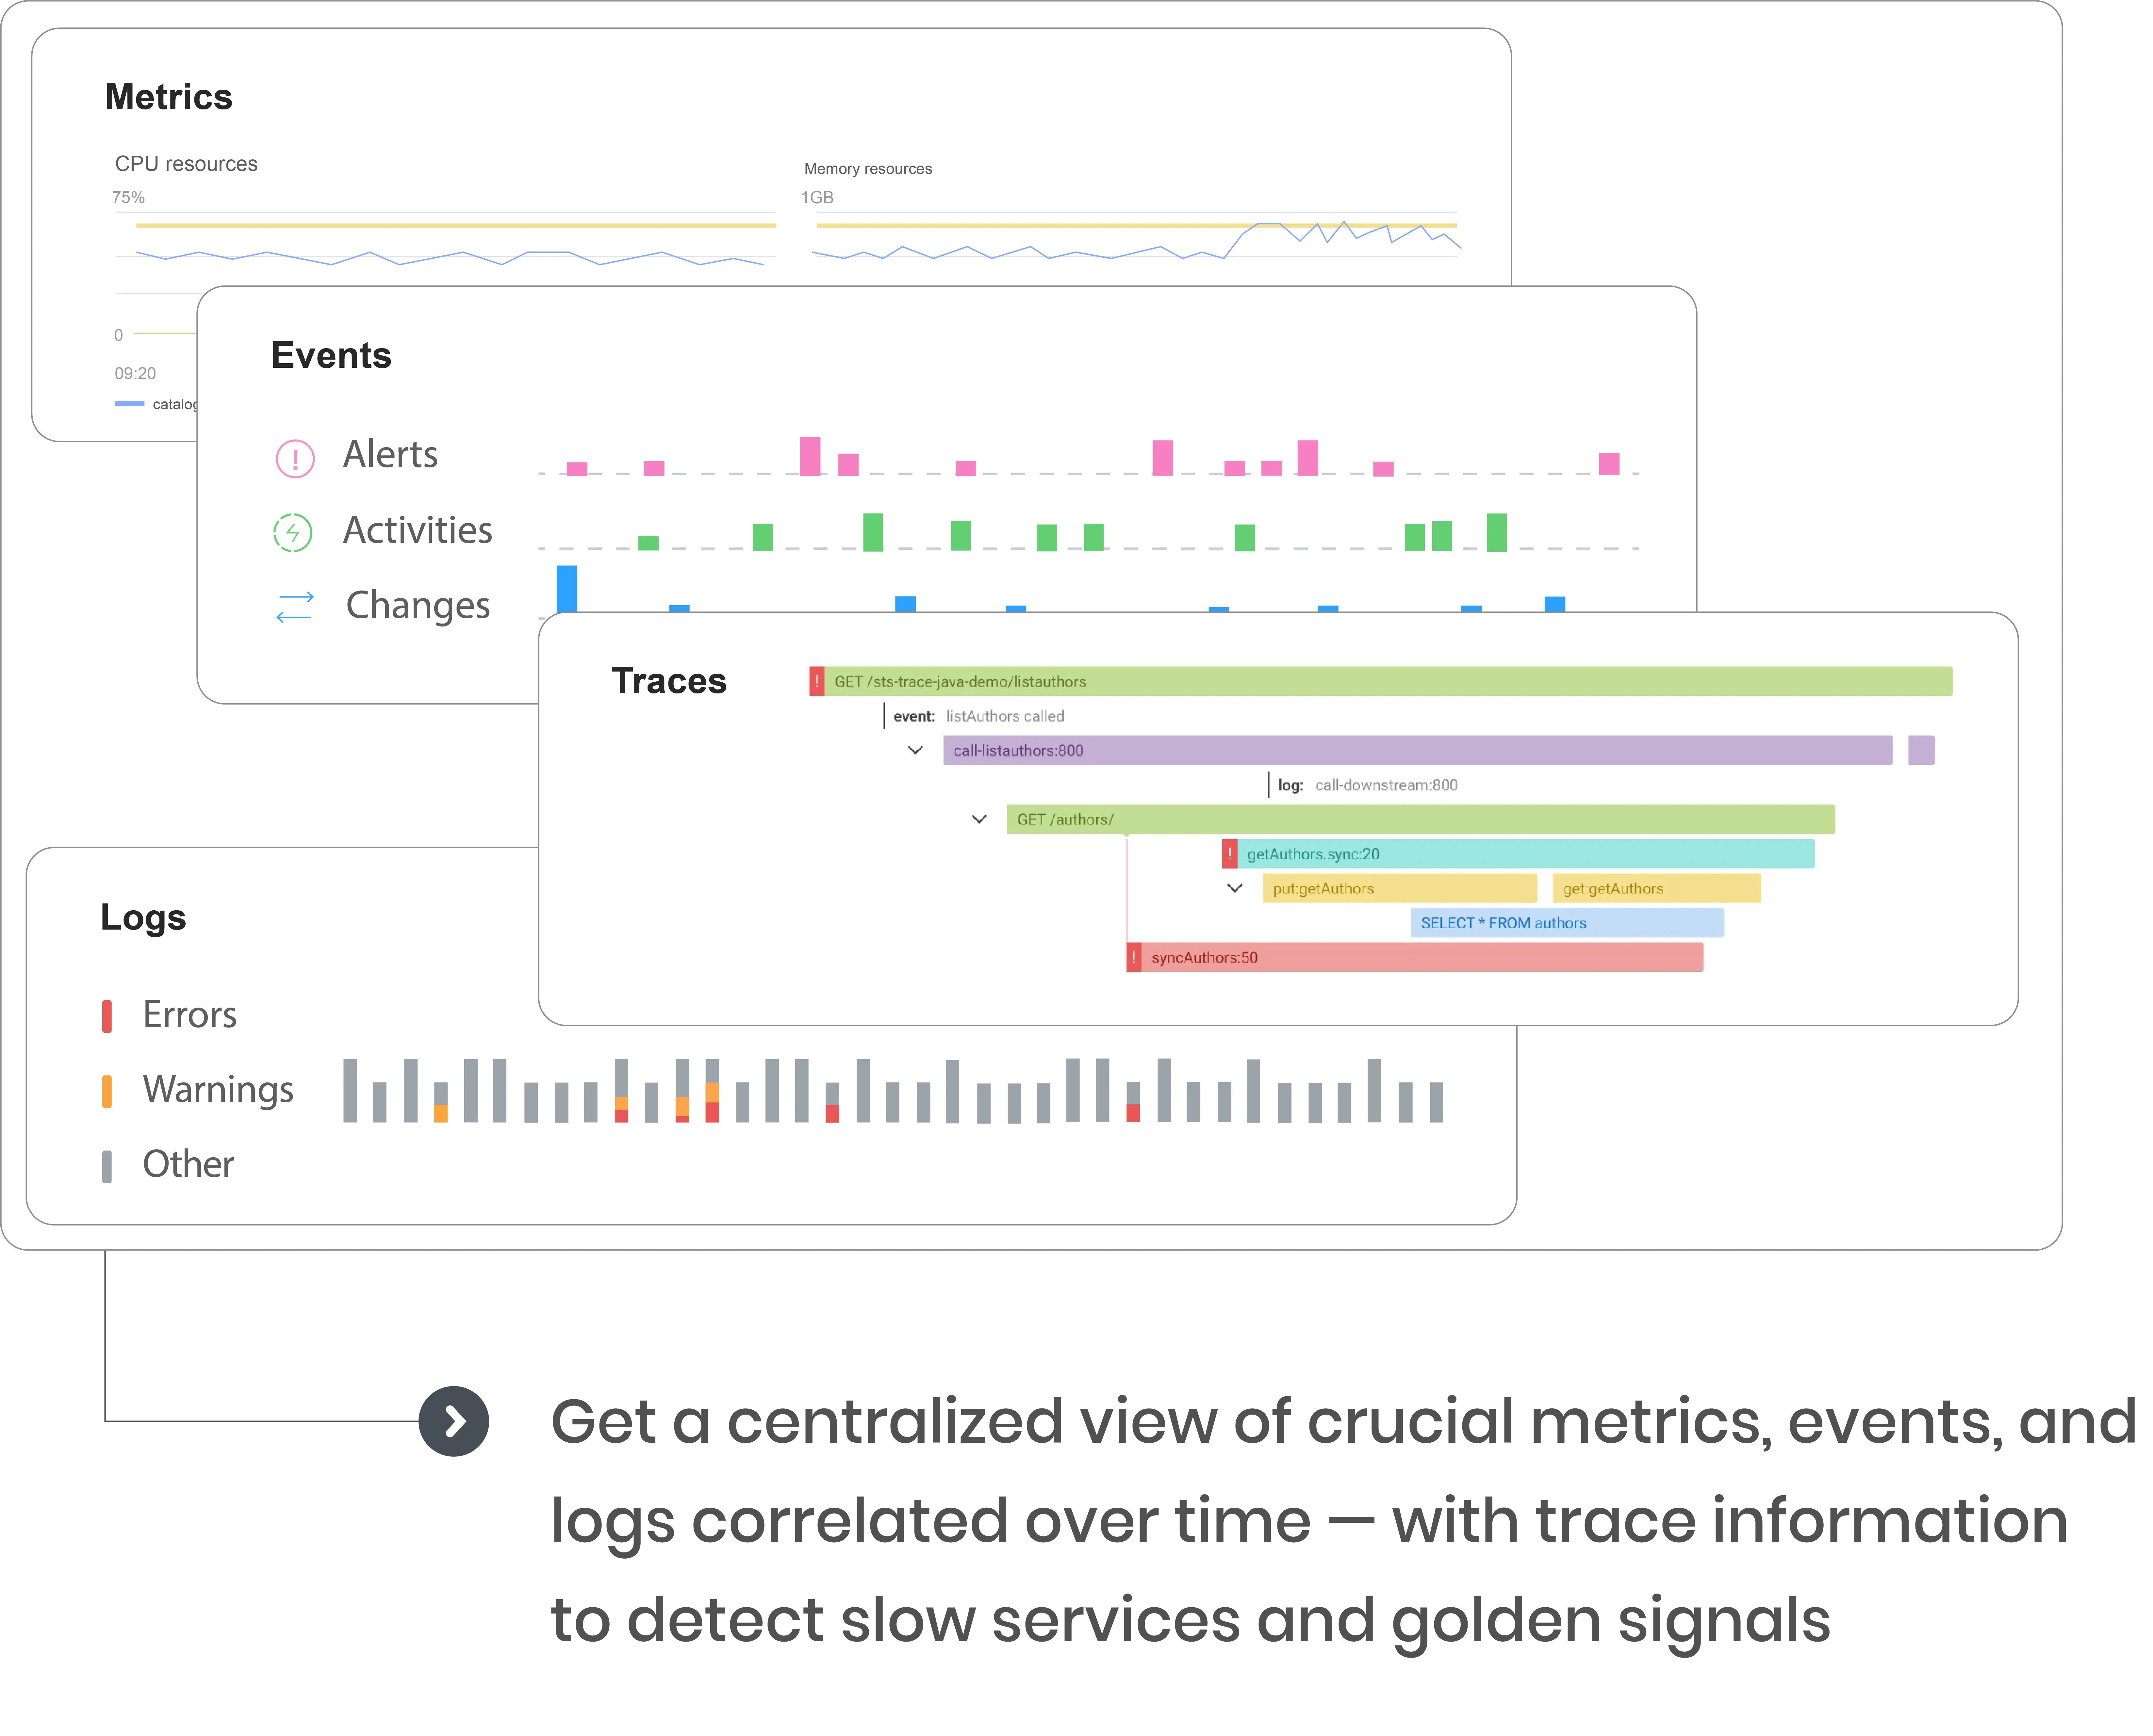
Automatically correlate all metrics, logs, events and traces using open standards like eBPF and OpenTelemetry
Seamlessly integrate insights from deployments, changes, and alerts
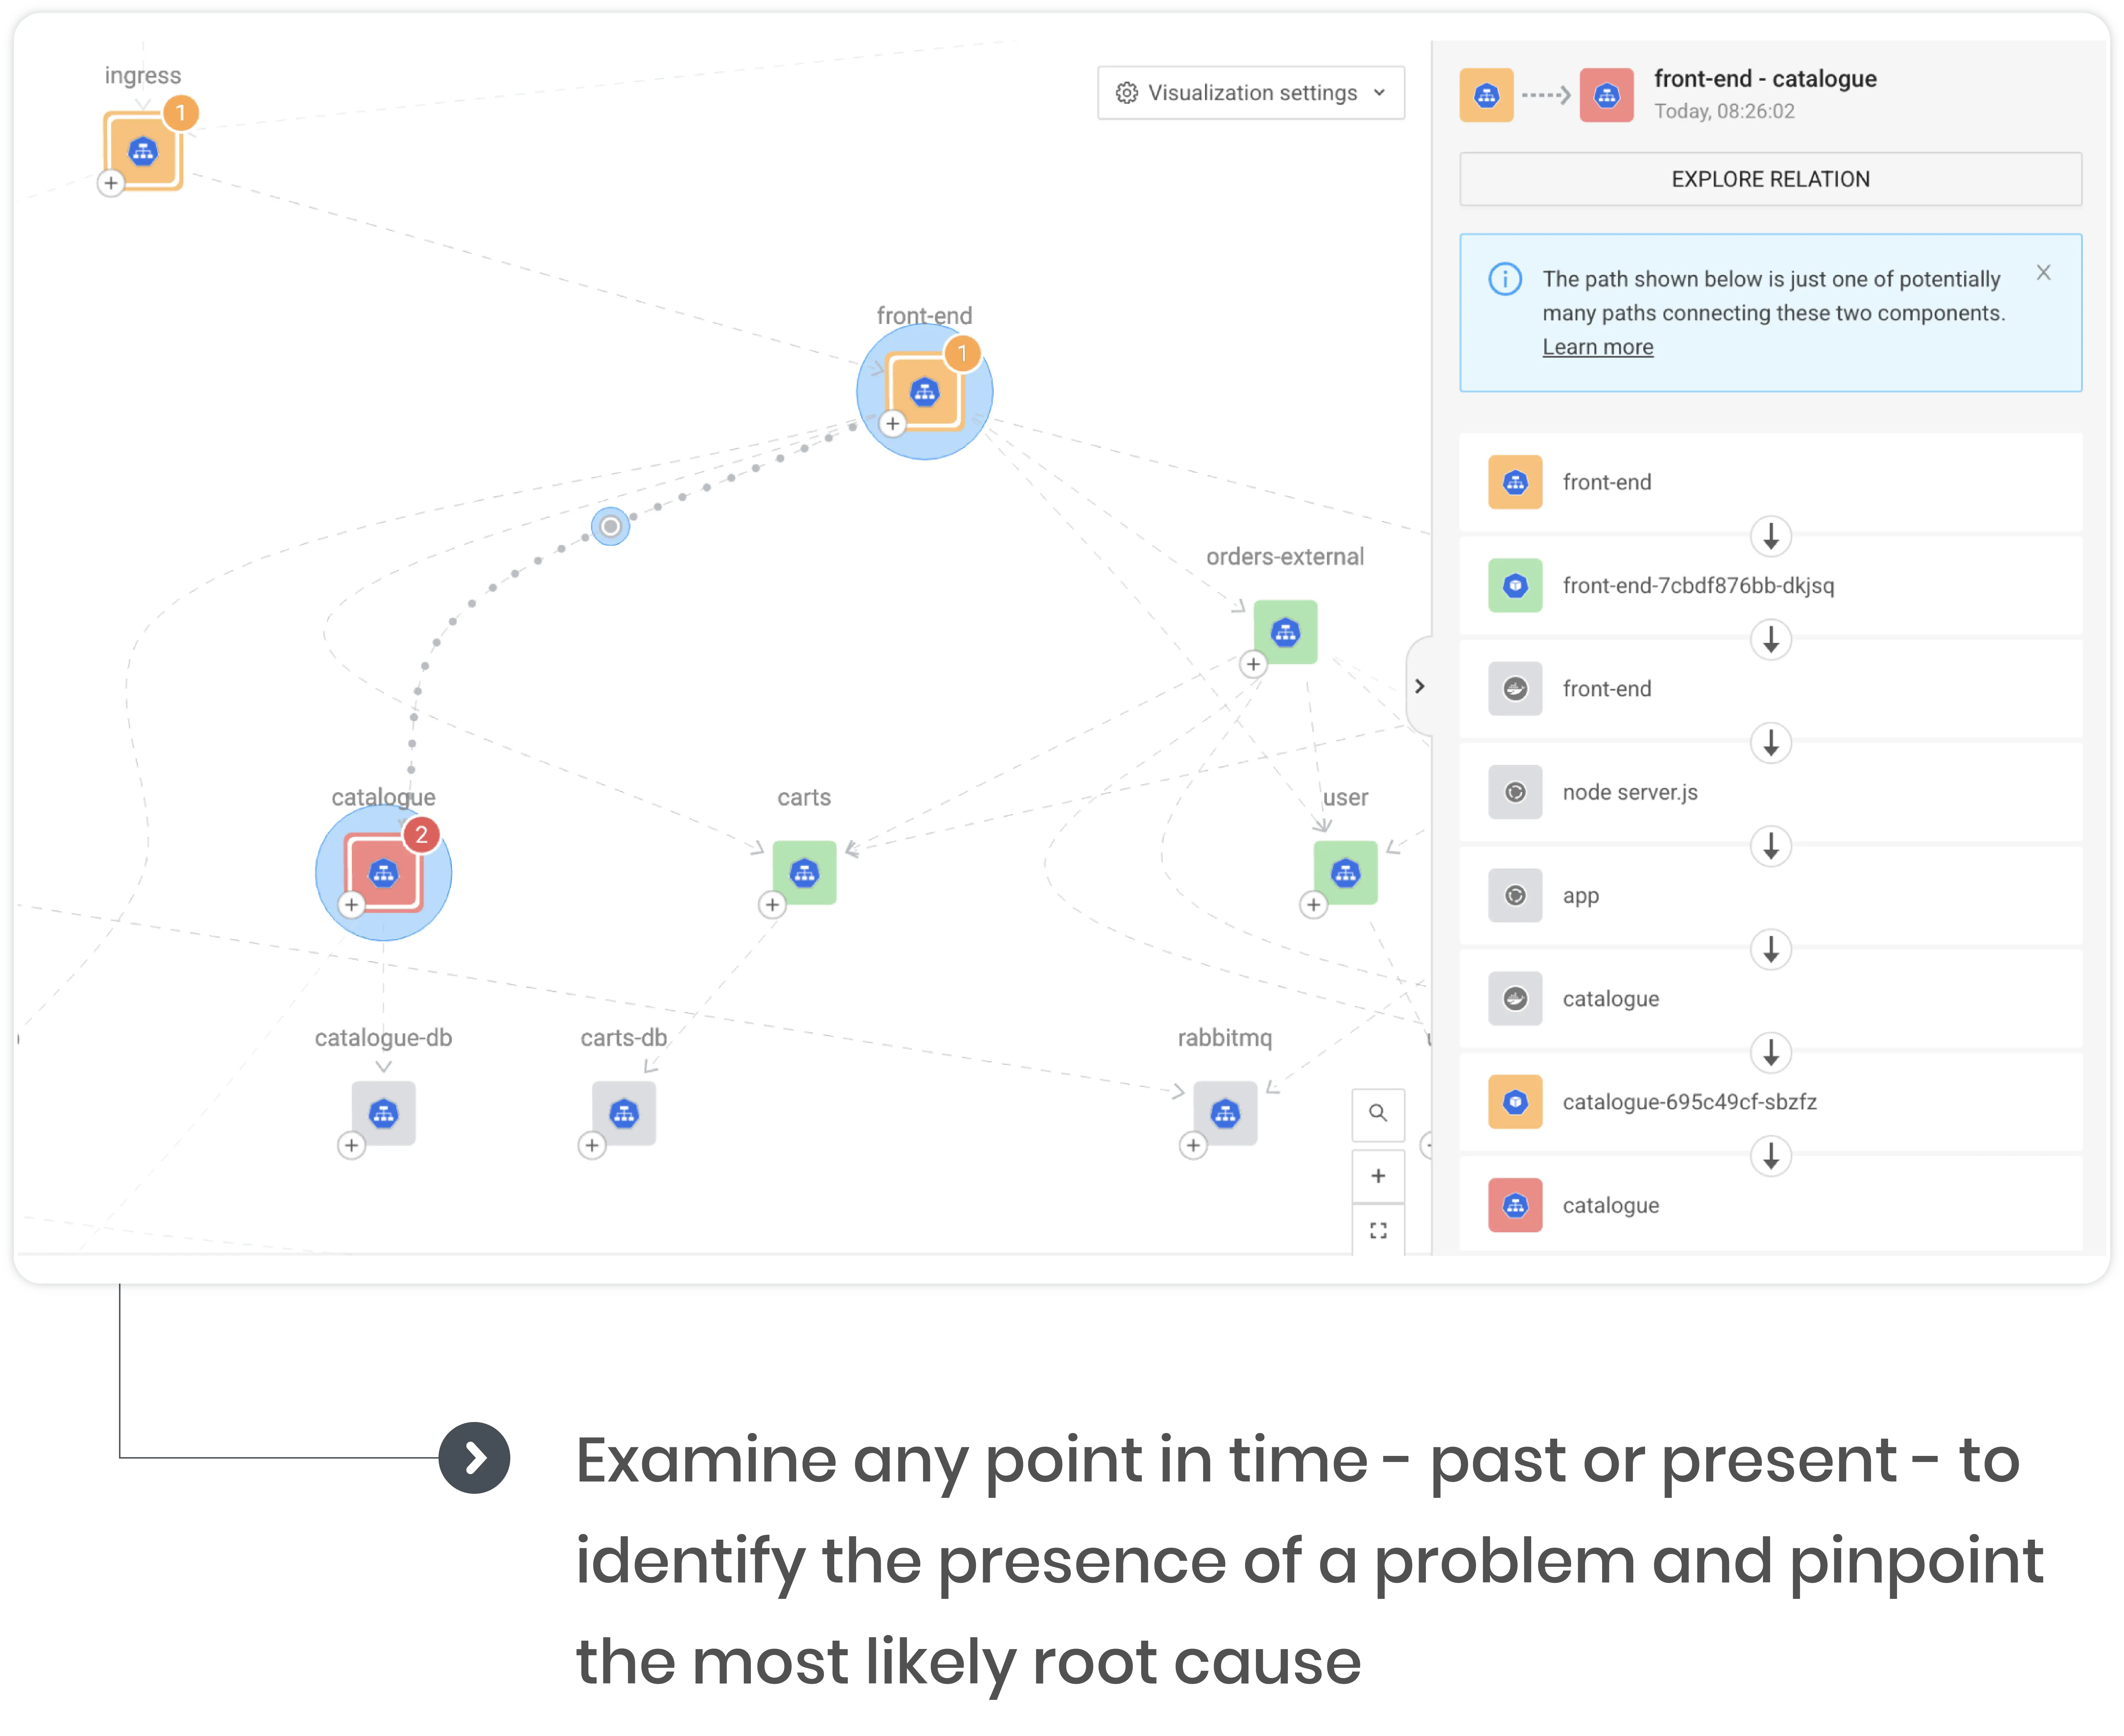
Real-time topology enhances understanding of component relationships for easy issue analyses
Glean insights to spot patterns, avoid bottlenecks, identify issues, and take action to resolve and optimize services
Speed up issue resolution by simplifying data correlation
Empower engineers with automated data correlation, revolutionizing troubleshooting for precise insights, streamlined operations, and enhanced system management.
Understand how applications are interrelated and performing — in real-time, always up-to-date, and without manual configuration
Digging into observability data to tell a bigger story
Connecting the dots reveals what’s working and what’s not
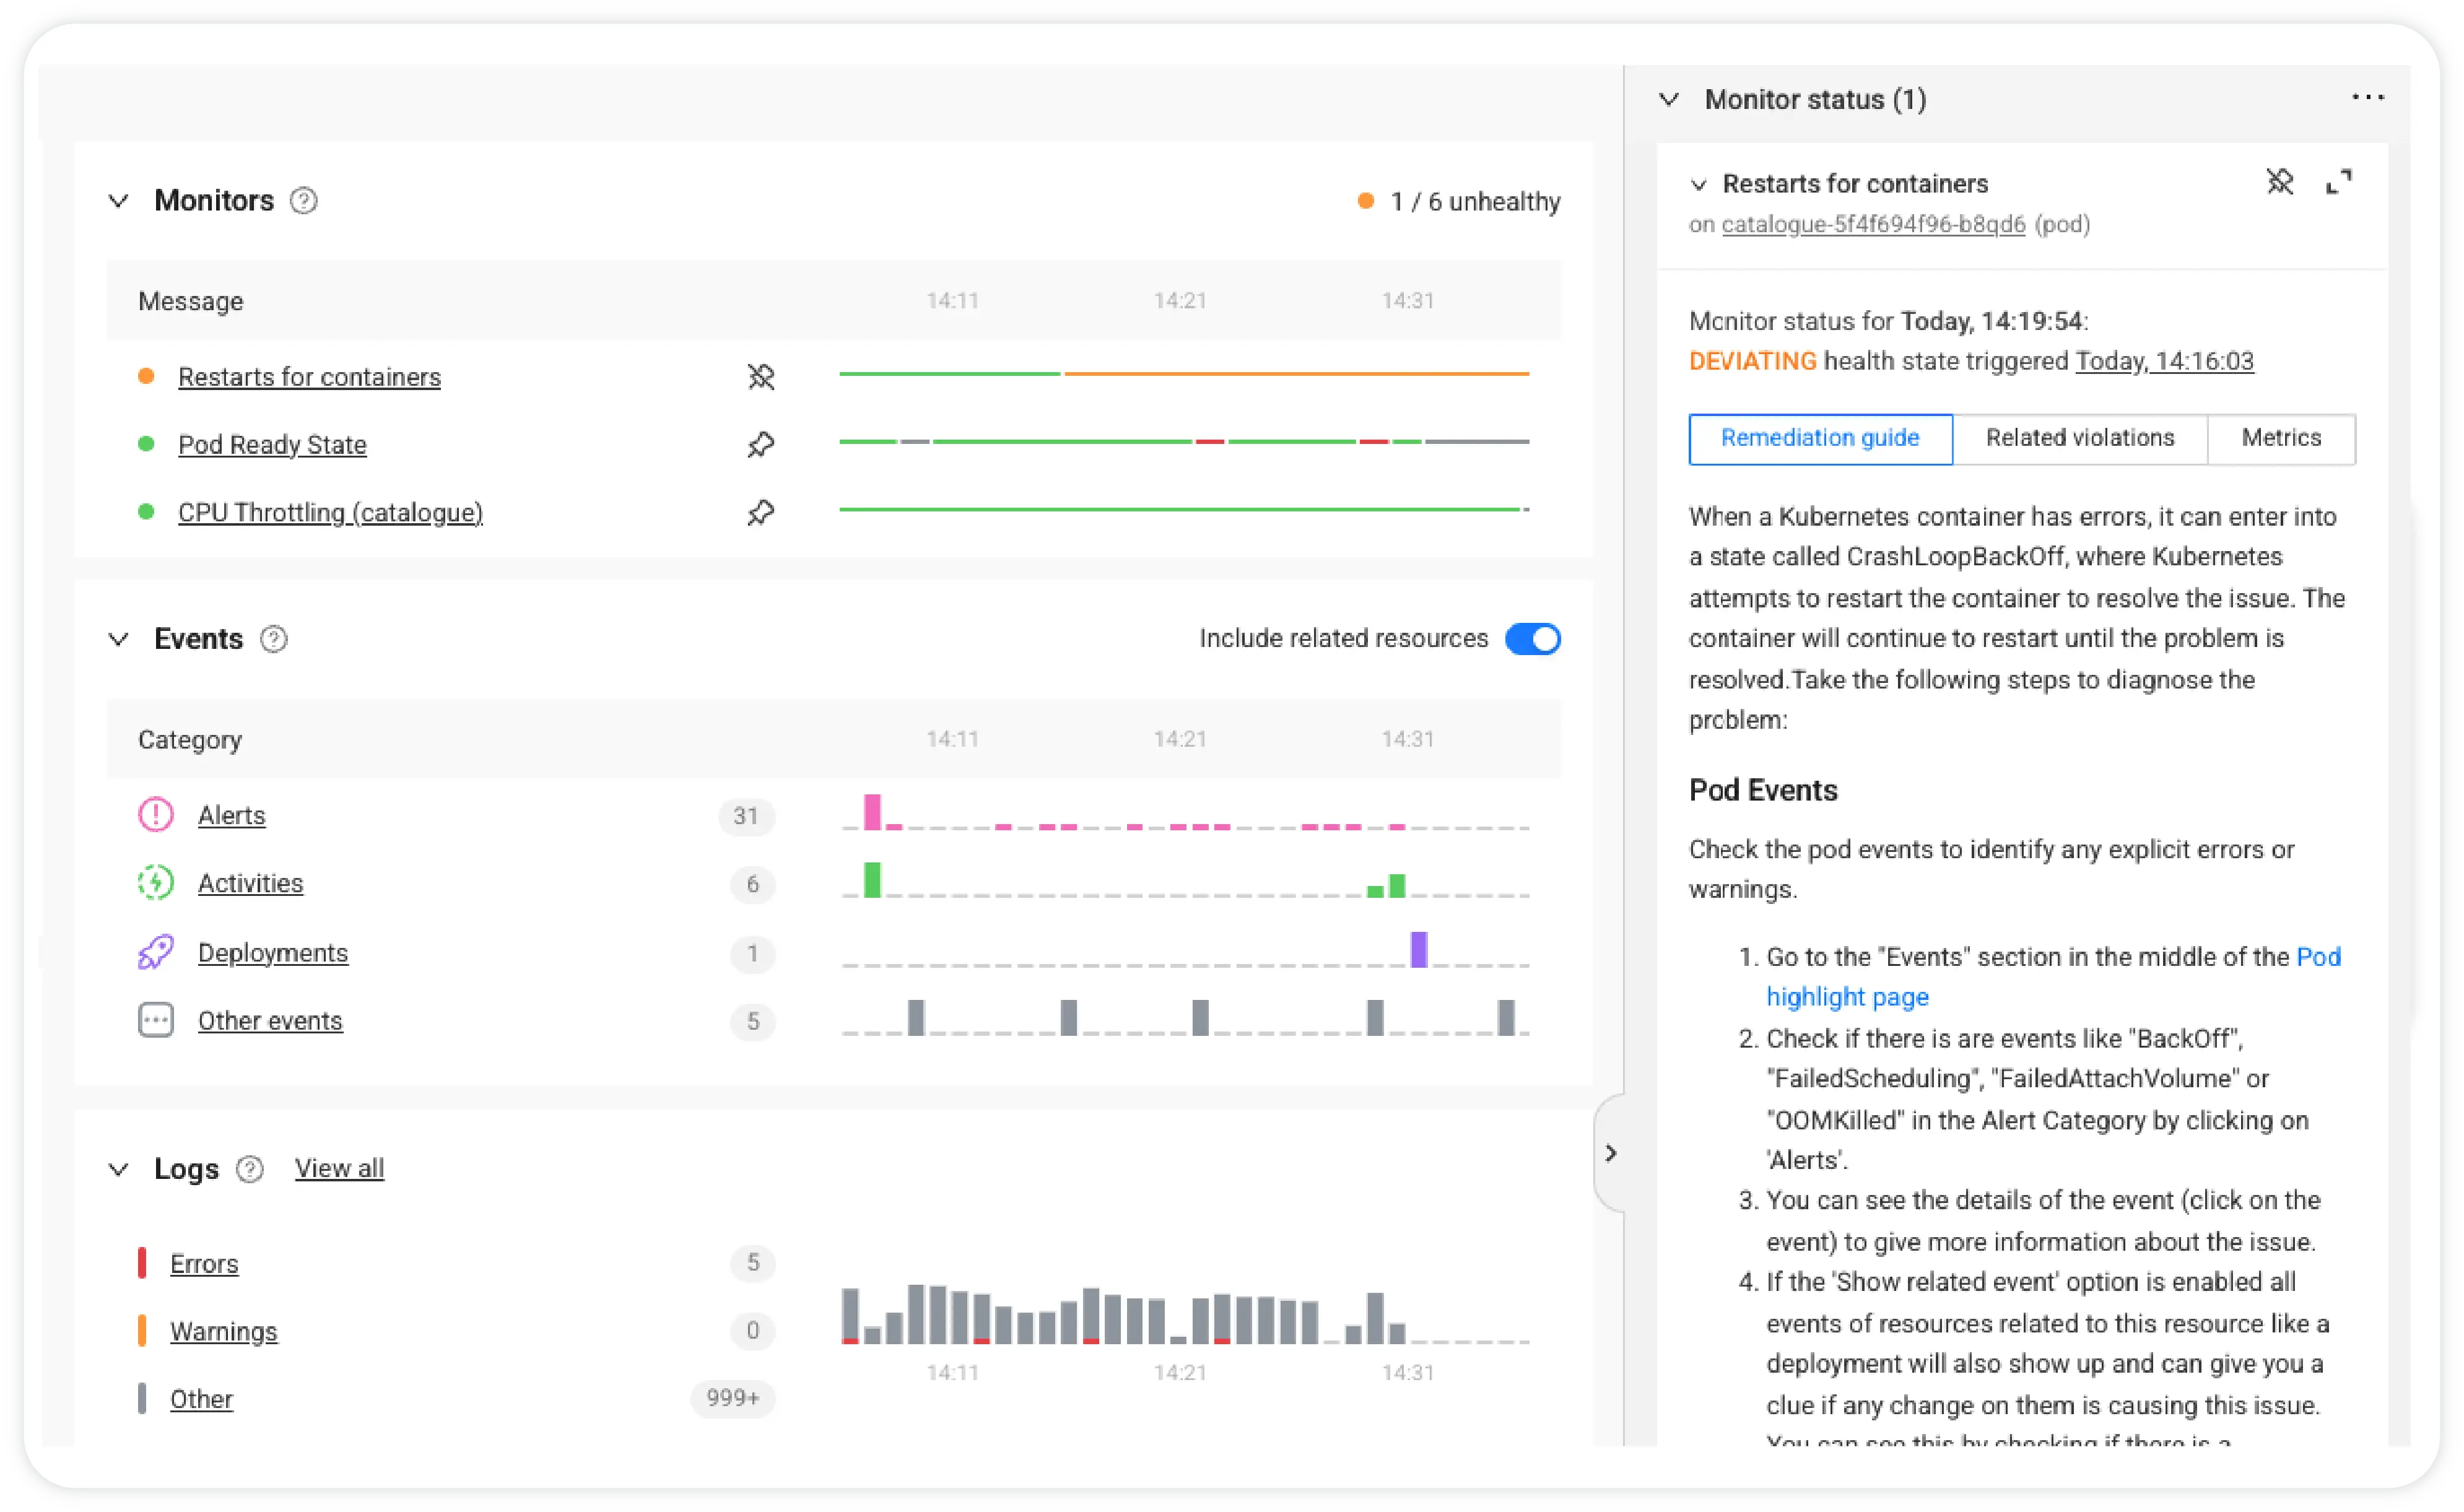
To establish a stable software environment and streamline tasks, StackState automatically observes, collects, and correlates diverse data types, creating a simplified and actionable solution for efficient troubleshooting and improved system operations. Collected data is systematically gathered and stored in a central, scalable M.E.L.T. store — short for Metrics, Events, Logs, and Traces.
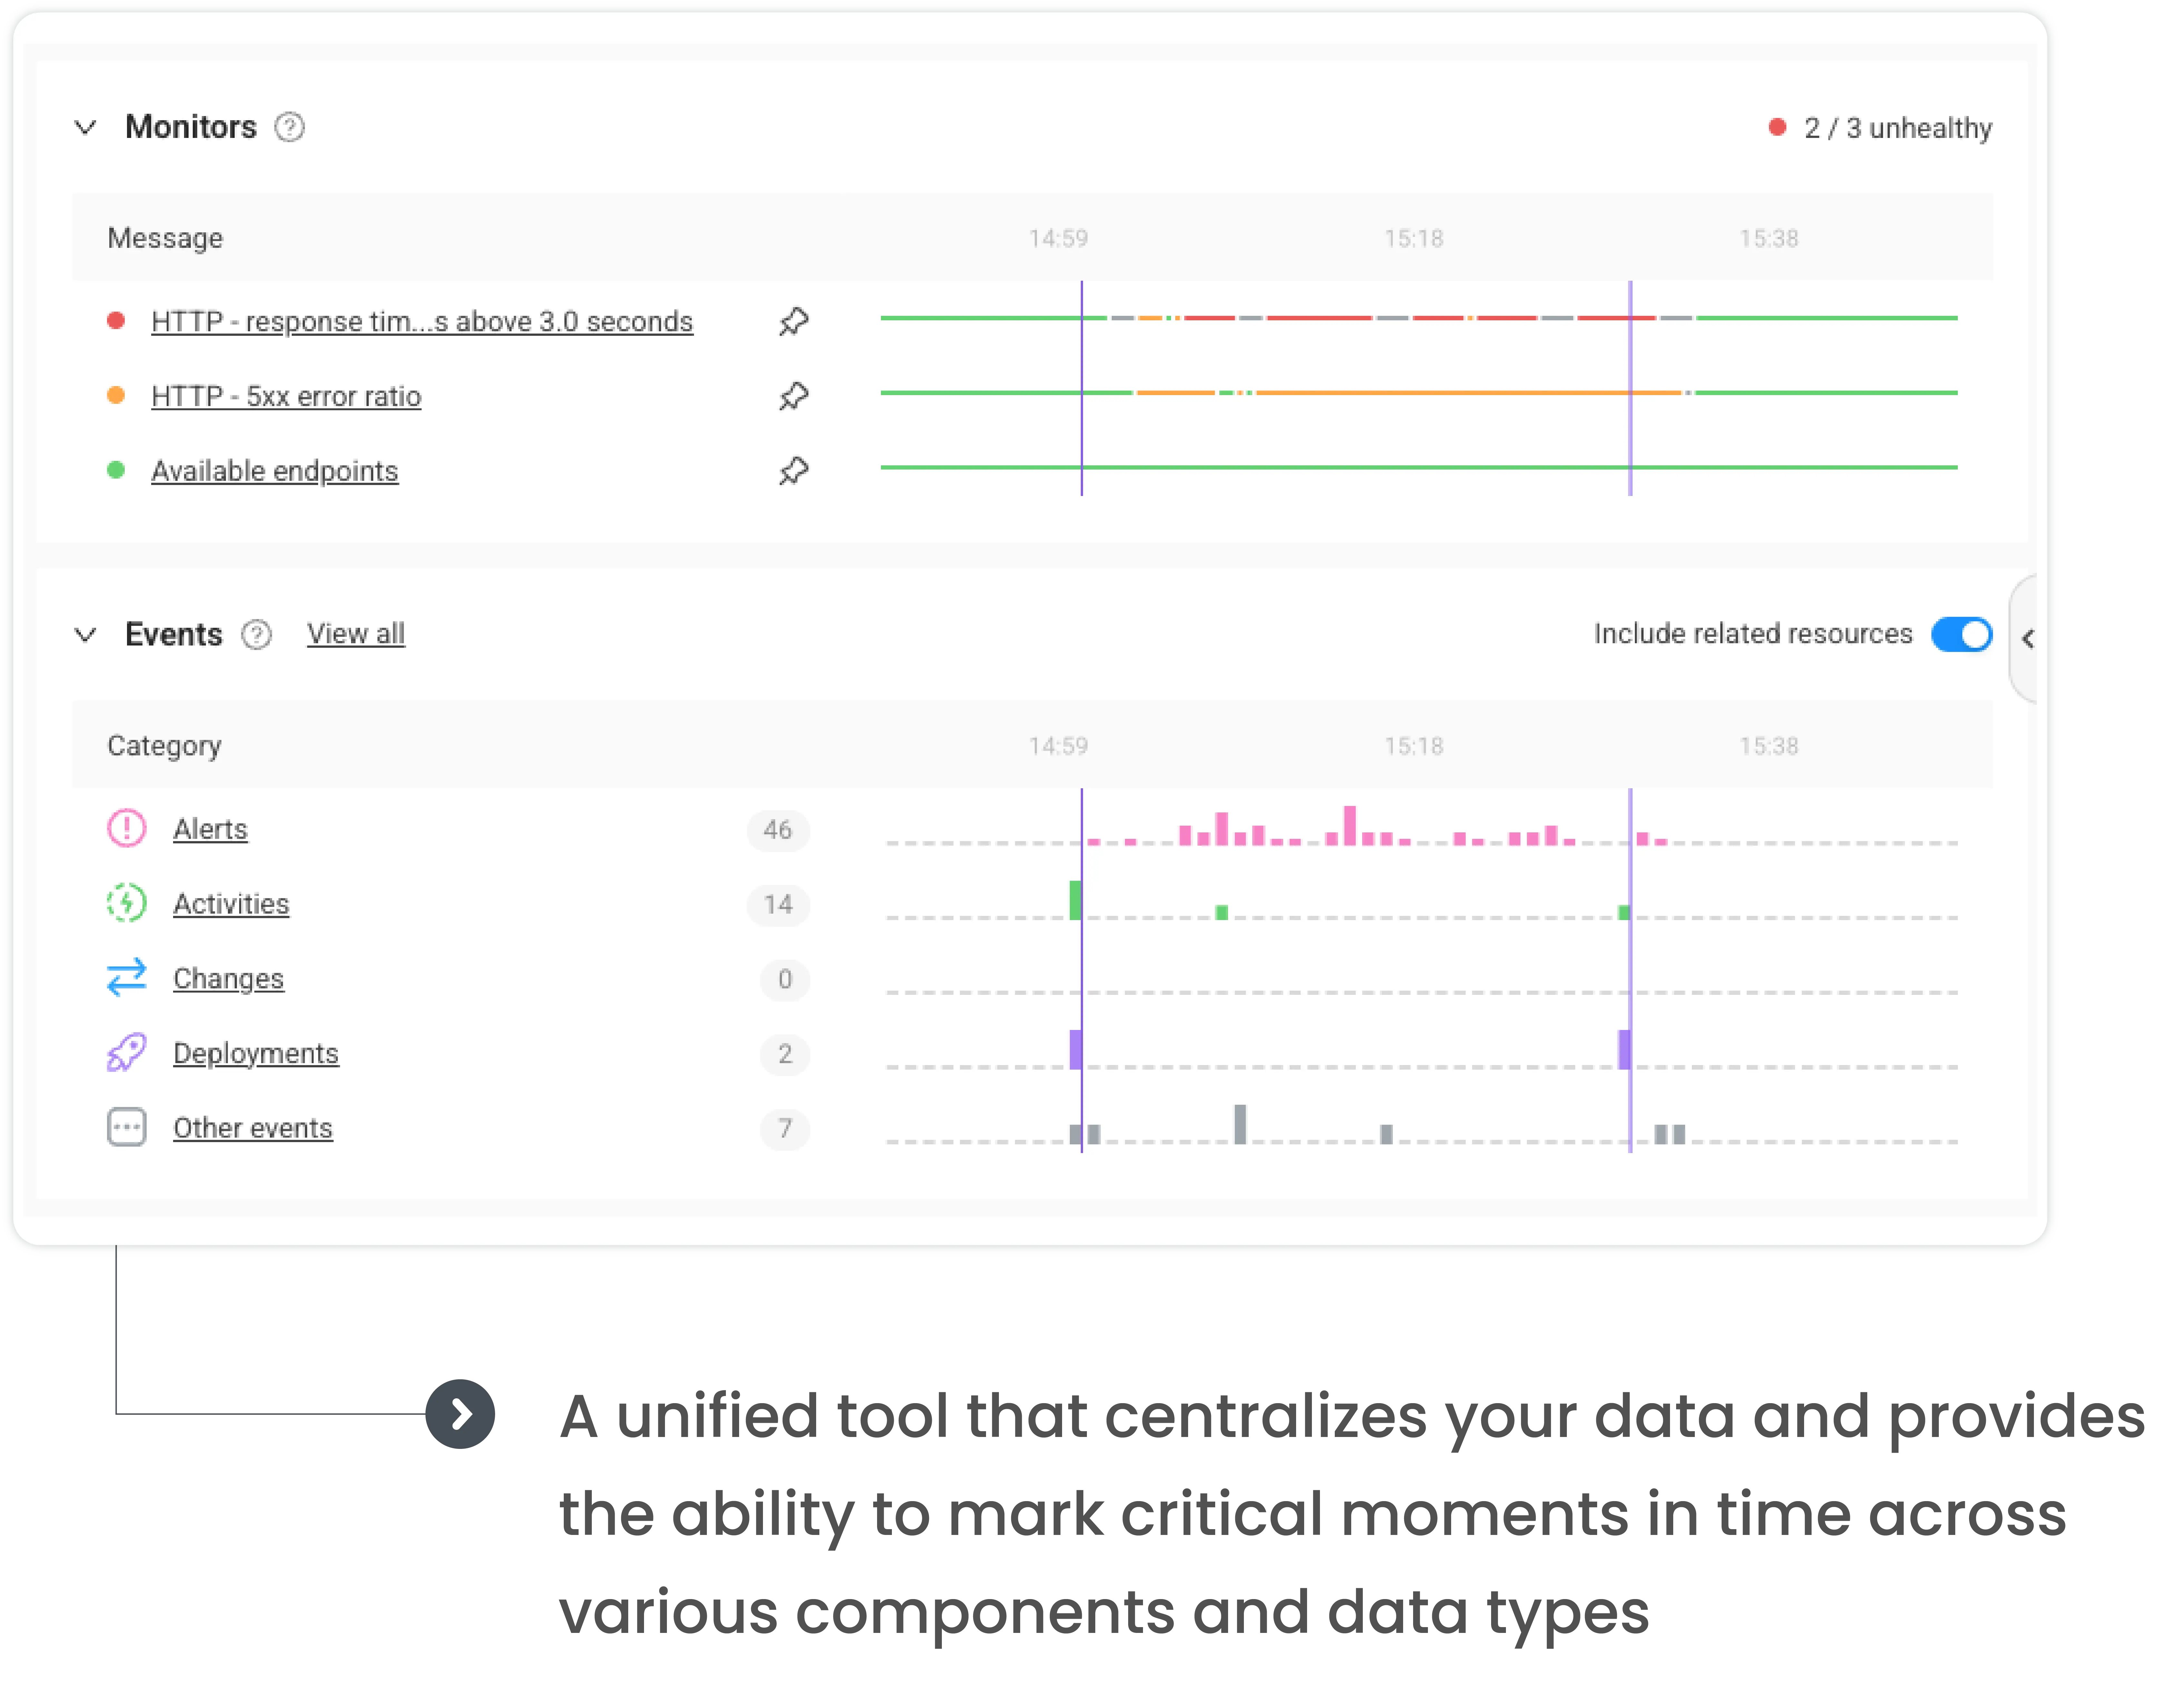
Yet, StackState goes beyond centralizing data; it provides the capability to mark significant moments across diverse components and data types. Whether it's a timestamp, timeline, event, metric chart, or health visualization, connecting the dots becomes second nature, fostering a better — and shared — understanding of complex interactions and dependencies.
Ensure the big picture remains in focus
Every event — no matter how small — contributes to a changing perspective.
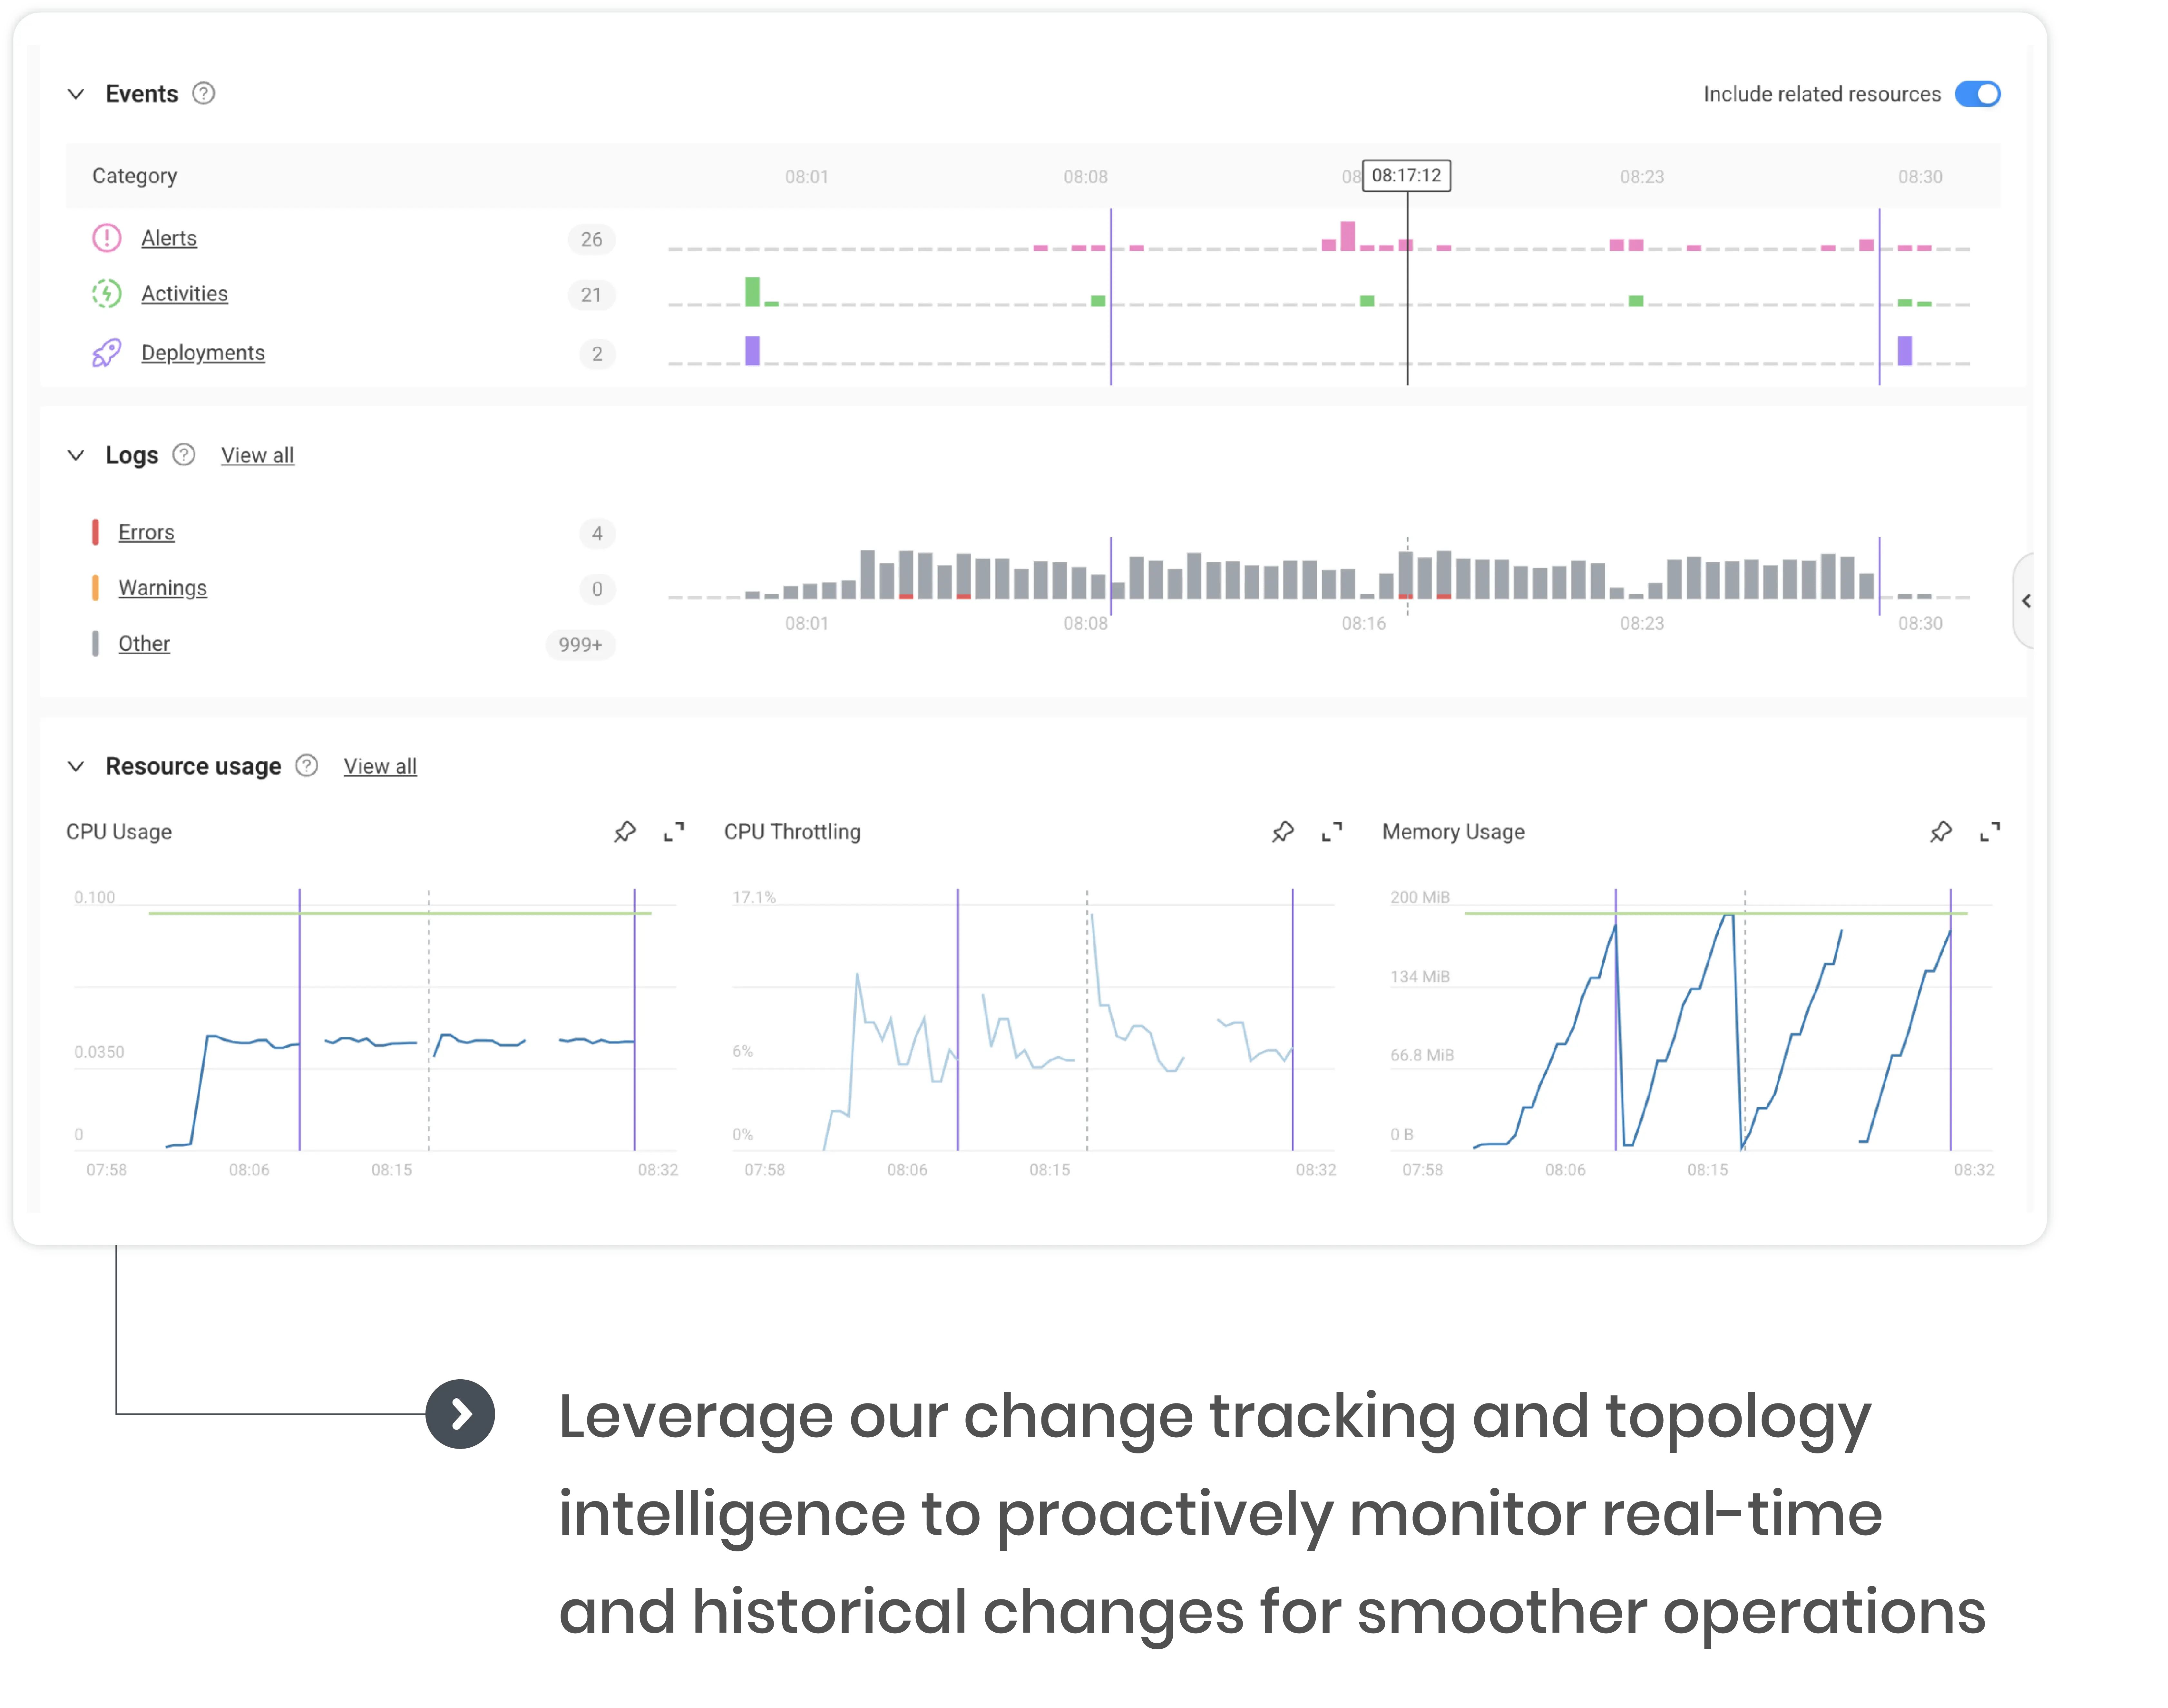
Our Comprehensive Event Timeline offers a panoramic view of events unfolding within your system, going beyond traditional approaches by seamlessly integrating insights from deployments, changes, and alerts from any linked resource. This feature highlights the connections within the systems and how they’ve changed over time, ensuring that the bigger data picture always remains in focus.
By including all events tied to specific resources, StackState provides your engineers and DevOps teams with a unified and contextual view. This empowers them to make informed decisions about maintaining high-quality services, identifying and avoiding potential bottlenecks, and streamlining troubleshooting activities to find and fix issues fast.
Drifts happen — even in well-aligned systems
Users identify changing relationships between resources and understand how to address these changes.
Digital environments are constantly changing, and staying in sync with the evolution of resources is paramount. That's where StackState's "Change Insight" feature is applied — giving users the ability to quickly identify resource interactions that may have changed over time and providing a comprehensive understanding of their system's dynamics.
A significant challenge in effective troubleshooting is detecting and repairing configuration drifts. With the powerful capability to trace changes, StackState makes it easy for users to pinpoint hard-to-spot system configuration shifts, course-correct as needed, and ensure that customer-facing offerings remain consistent and optimal.
Precise data insights start with marking critical moments
Better and faster analyses, all without bouncing between tools.
When troubleshooting, the ability to pinpoint critical moments is a game changer. While StackState's automated correlation engine simplifies issue identification and enhances accuracy for optimal problem resolution, our Timeline Marking feature takes this capability to new heights.
Timeline Marking goes beyond a simple bookmark; it introduces a novel navigation method, liberating users from juggling multiple data points. In essence, Timeline Marking improves precision data correlation and revolutionizes how users interact with and navigate through their data, ensuring a more efficient and user-friendly approach to problem-solving.
Built on Open Source; built for Open Source
Aggregate and correlate data from diverse monitoring tools.
At StackState, our commitment to open-source software is ingrained in our DNA, as we've long built on and contributed to open-source collaborations. Utilizing accessible components like HBase, Kafka, ElasticSearch, Akka, and React, we've accelerated the development of our observability platform, notably the StackState agent and agent integrations.
By consolidating telemetry from various monitoring tools into a unified platform, our full-stack observability platform simplifies IT environment management by eliminating the need to switch between Kubectl, Prometheus, Grafana, Kiali, Jaeger, and other tools. This approach helps us automate data collection and correlation, enabling you to reduce MTTR, minimize outages, and accelerate application releases.
Faster issue resolution through advanced data correlation
StackState simplifies operations for SREs, platform leaders, and DevOps engineers by automating data collection and correlation so teams can quickly address problem areas without the trouble of constant tool-switching and data retrieval. This all happens in one interface, saving valuable time for enhancing or developing new applications. As the category-leading full-stack observability platform, StackState makes troubleshooting a breeze!
Curious to see how advanced data correlation works at StackState?
Open, extensible, and easily integrates with all major cloud platforms and solutions
SOC 2 compliant • Low eBPF overhead • OpenTelemetry-native