A new perspective
Topology has always been StackState's strong suit. The ability to see a real-time, always up-to-date map of your complete IT landscape, at any point in time, is where StackState started and what we are best at doing. But we've always known that to be the best tool for managing your IT infrastructure, we need to add even more types of information. Because you need to understand how the resources in your landscape are doing. Are they for example, in trouble or under dimensioned? That is why we layered telemetry on top of our topology. Topology and telemetry are, in a way, two sides of the same coin. They are not distinct data sets that have no connection, or that should live in separate tools. We see them as two different ways of looking at the same thing, your IT landscape. We've started calling them perspectives, and in this StackState release, we've placed them front and center.
"Psst...renowned global research company Gartner has listed all Artificial Intelligence for IT Operations (AIOps) vendors in their New Market Guide.
Focusing on Telemetry
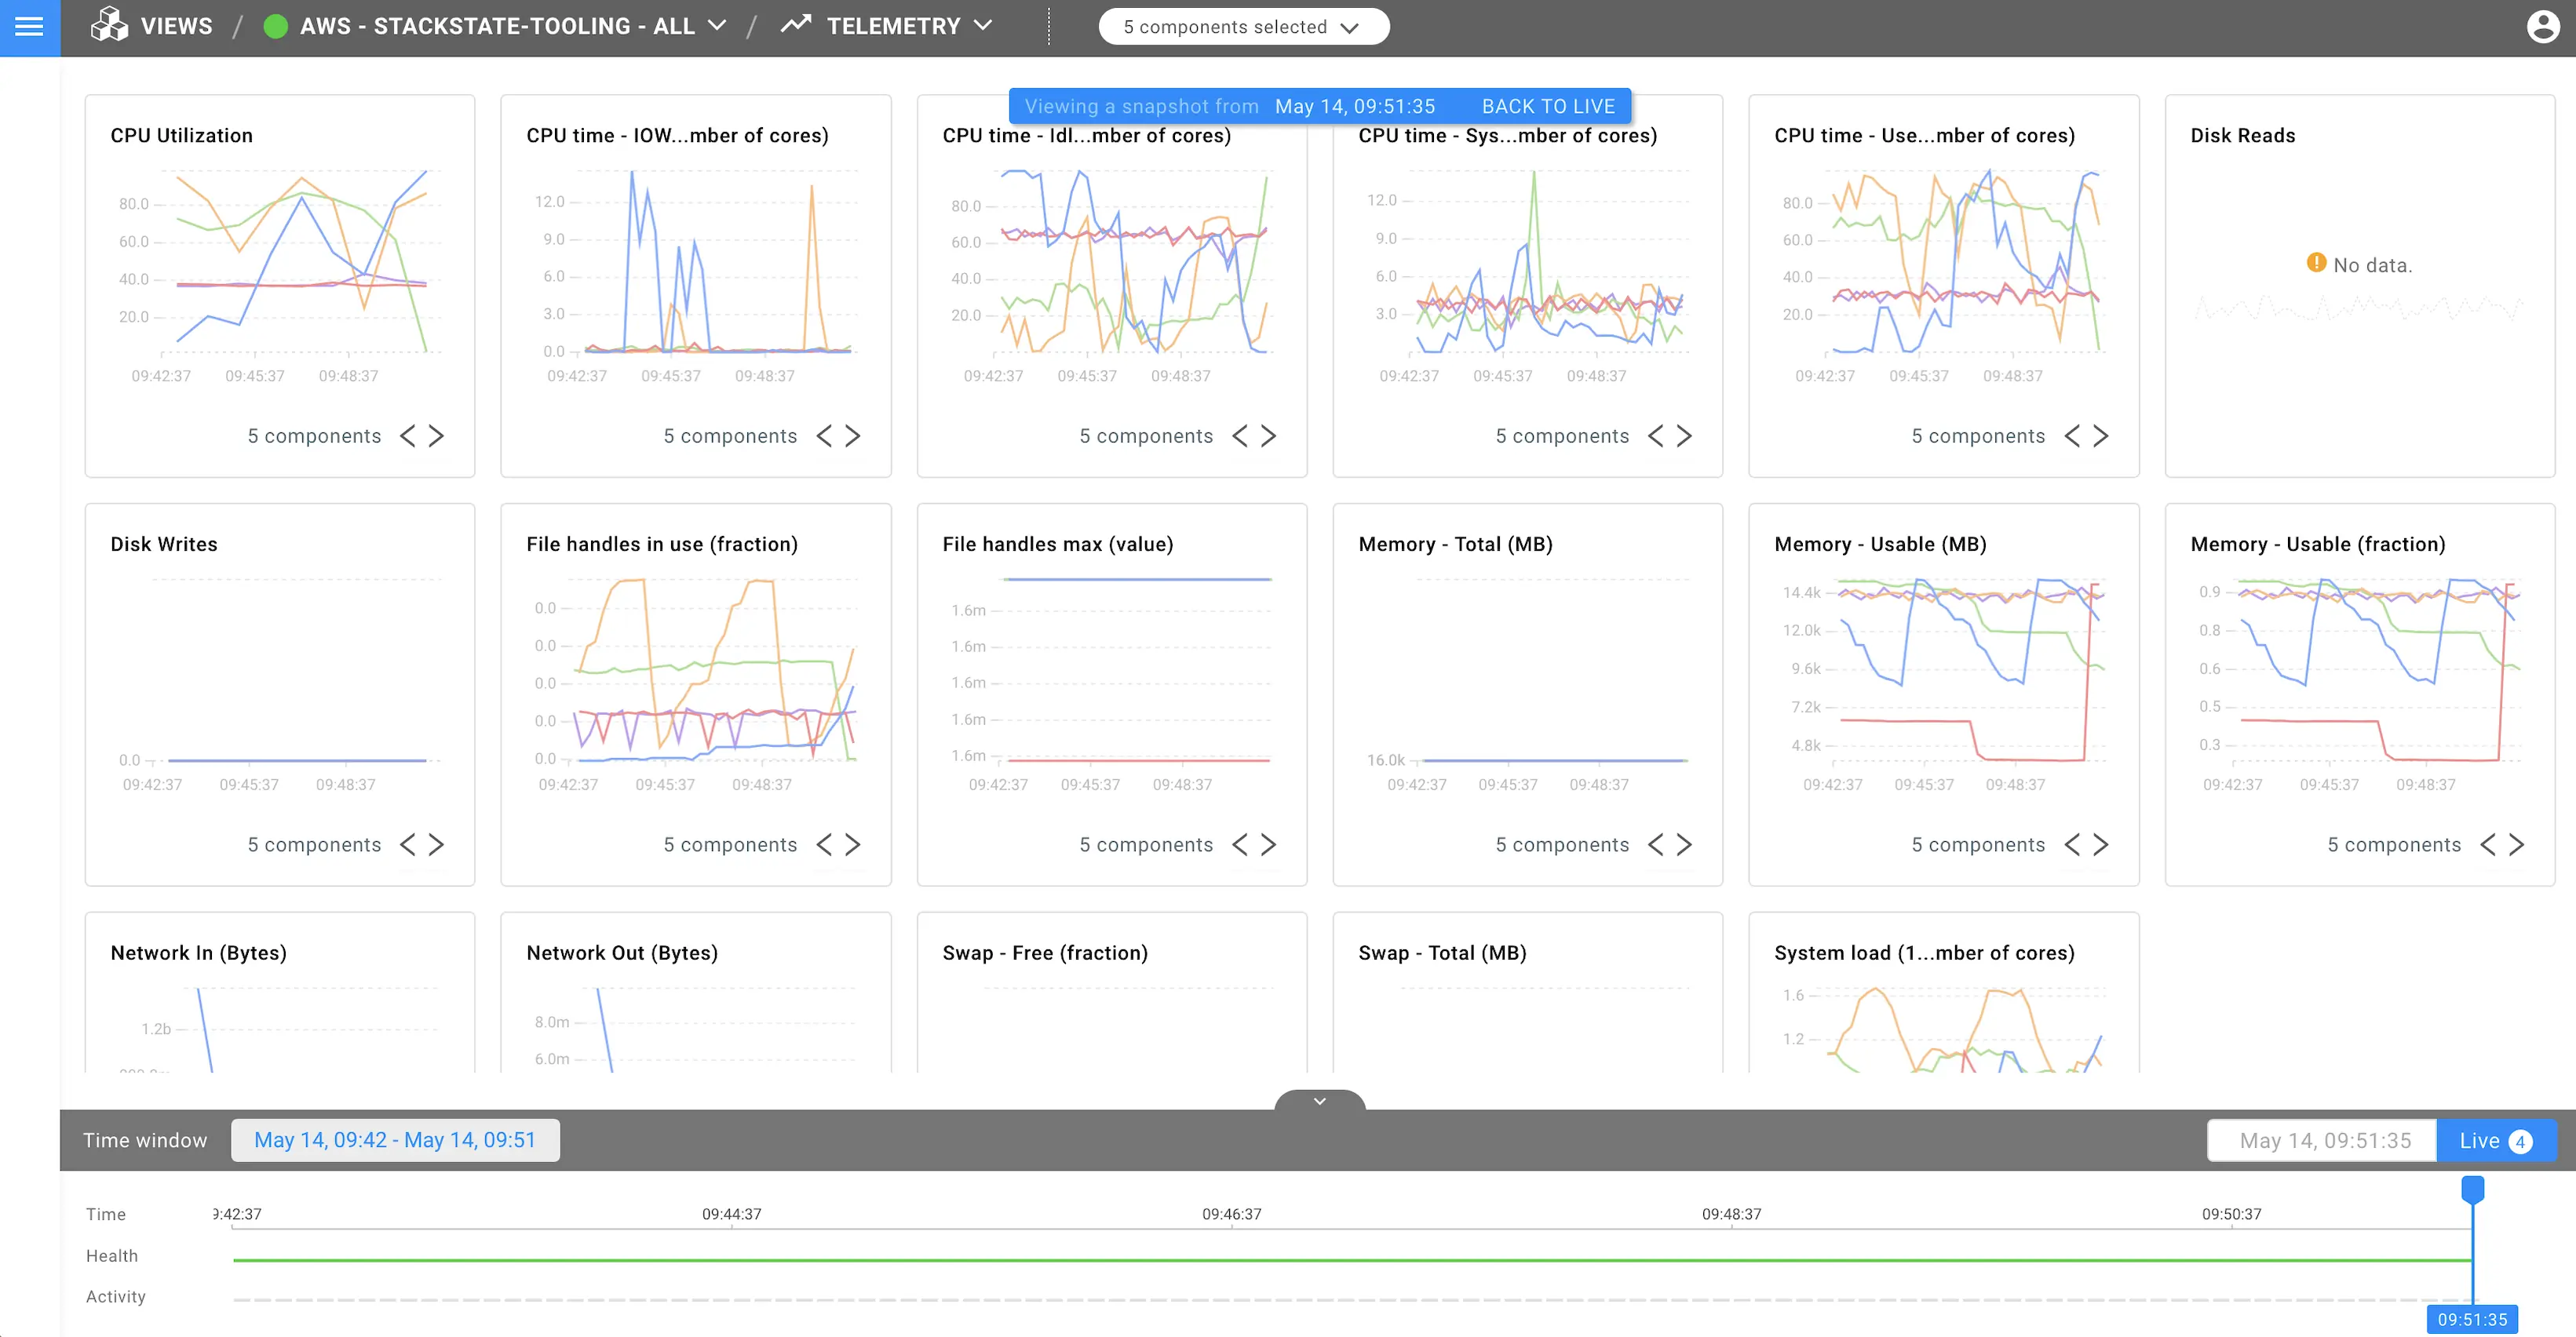
StackState delivers a whole new way to interact with your IT landscape. In addition to a real-time, always up-to-date map of your IT resources, you can view the same landscape through the lens of telemetry. We're calling it the Telemetry Perspective.

The Telemetry Perspective brings together all important telemetry streams for a view and provides you with an automatic dashboard of sorts. Instead of pre-defining which streams you want to see, StackState automatically delivers all the relevant information for any part of your landscape. Customers can use the Telemetry Perspective to jump straight from a part of your landscape to the relevant telemetry. If you are investigating a problem and you've found an unhealthy component, you can switch directly to the telemetry perspective to see all critical metrics for the component and its dependencies with a single click. The Telemetry Perspective allows you to compare the same metric for different components in a single graph so you can spot anomalous patterns. For example, you can analyze how different Java Virtual Machines (JVMs) in your applications use their memory and whether one of them is causing a problem. Traveling through time affects all perspectives, so if you focus on a past problem, switching from Topology to Telemetry perspective or vice versa, remember your chosen time window.
That's not all...
The Telemetry Perspective is not all that's new about StackState 4.0. Some other new updates are:
Topology search function:
easily find components in the topology view by typing
Scalability improvement:
view retrieval speed in large topologies and trace data handling
New integration functionalities:
compose StackPacks from multiple files
More to come
StackState 4.0 is the first release to incorporate the Telemetry Perspective. But we won't stop there! In the next few versions, StackState will come to include perspectives on observability — Topology, telemetry, events, traces, and logs. Perspectives make investigating issues more straightforward and faster and put all the information you need at your fingertips, so you can focus on being awesome at your job. Book a free demo to get more information about StackState.
About StackState
StackState provides topology-powered observability across all IT components and environments, enabling customers to autonomously detect anomalies, pinpoint the root cause, and assess business implications of new DevOps programs. A recognized "Cool Vendor" by Gartner, StackState has a successful pedigree of providing innovative solutions that reduce MTTR, maximize customer experience, and deliver cost-saving automation. StackState's platform integrates all data sources and monitoring tools to unify metrics, traces, logs, and events into a topological dashboard where AI-powered alerts enable operations teams to collaborate to resolve incidents precisely and efficiently.


