First we'll go into what SCOM is about. Second, we're going into the integration between SCOM and StackState and what it has to offer you. We'll also tackle the subject if you have the custom SCOM management packs. Finally we give you a nice overview of all the benefits there are for integrating your SCOM with StackState!
SCOM monitoring explained
Nowadays, many Microsoft applications like Exchange, Active Directory, SharePoint, Lync & Skype are used on a daily basis. Either internally by employees or as a service provided to customers as a cloud solution. Some of these infrastructure applications are considered highly critical. Especially the Active Directory or the messaging applications such as Skype for business. To show how critical they can be just imagine the following scenario: the DHCP or DNS role in an enterprise is down. No one can get new IPs, there's no DNS resolving, and if the Active Directory services are also down, nobody will even be able to login. This severely impacts business performance. Even worse, if this happens to a cloud service provided to consumers, this will lead to massive service disruptions breaching Service Level Agreements (SLA's). Enter System Center Operations Manager (SCOM)... SCOM is used to monitor all vital infrastructure applications to try and avoid critical situations like the one described above. SCOM does this by providing very detailed information, generating alerts, and warning the administrators in case of an incident.
"Psst...renowned global research company Gartner has listed all Artificial Intelligence for IT Operations (AIOps) vendors in their New Market Guide. Download your free report right here!"
The synergy between SCOM & StackState
Starting from SCOM 2016 (1801), Microsoft introduced a REST API endpoint. This API is used to extract data from the operations manager. StackState uses this endpoint to gather topology and telemetry to enrich your IT environment with SCOM data. To show how the StackState and SCOM integration works we show you an example for Microsoft Exchange based on SCOM data. In this example we're showing the topology, views & health states and telemetry & alerts.
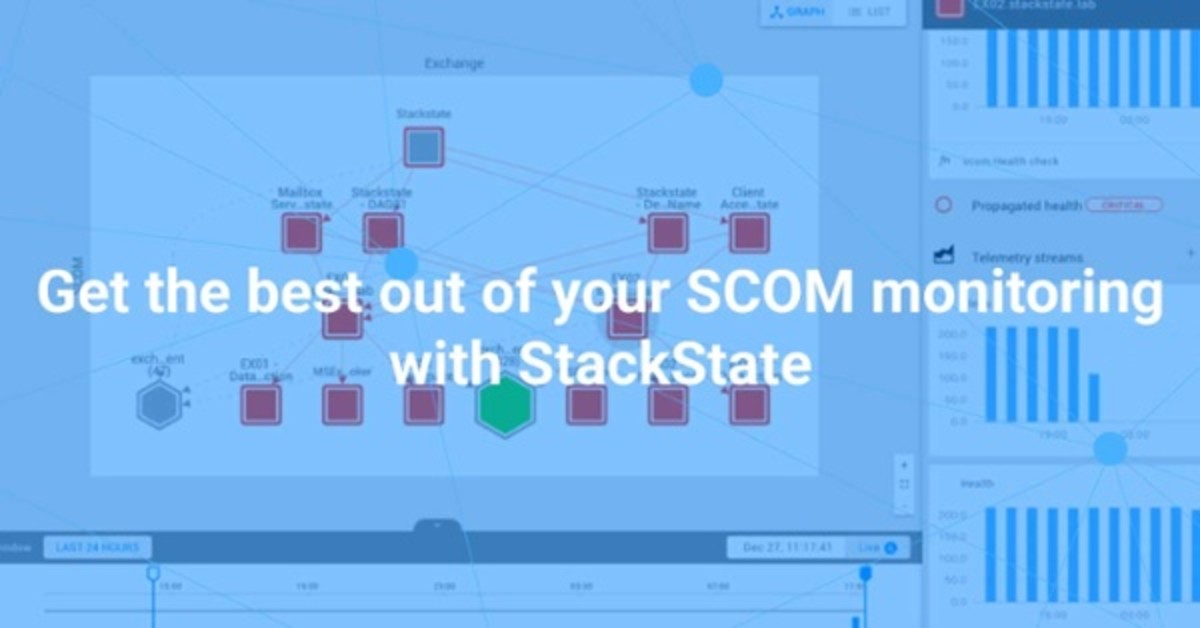
Better topology, views & health states
Because of StackState’s powerful topology visualizer you can segment your environment in specific 'views'. For example: in your Microsoft Exchange environment, you want to see the components that are located only in Datacenter A. Or you would like to see the servers with only a mailbox role. With StackState's 'views' functionality it is possible to make such filters. Some teams may find it useful to really drill down with this functionality while other teams may only be interested in seeing the top-level components’ status.
This topology visualization contributes in decreasing the MTTR or showing the RCA. When a change request is done to a system, other affected applications can be easily spotted to inform the application owners. Check out the StackState topology with health statuses here below!
Triggering telemetry & alerts
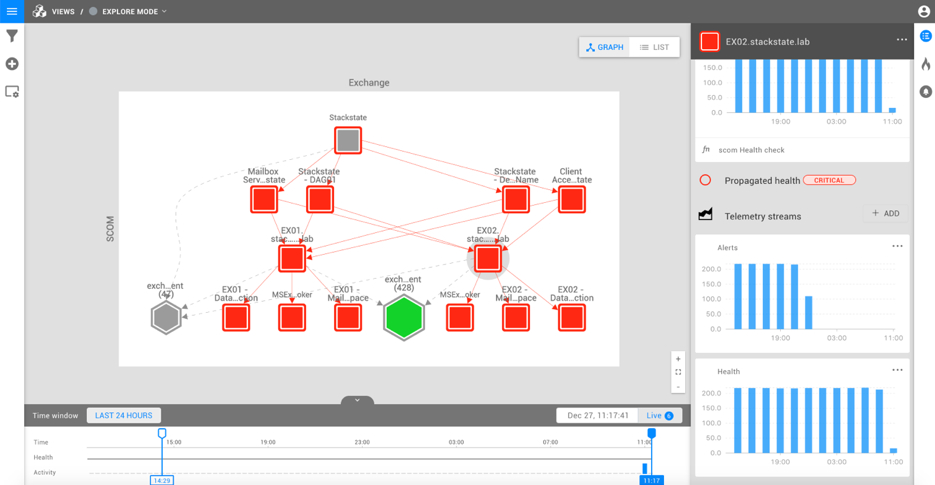
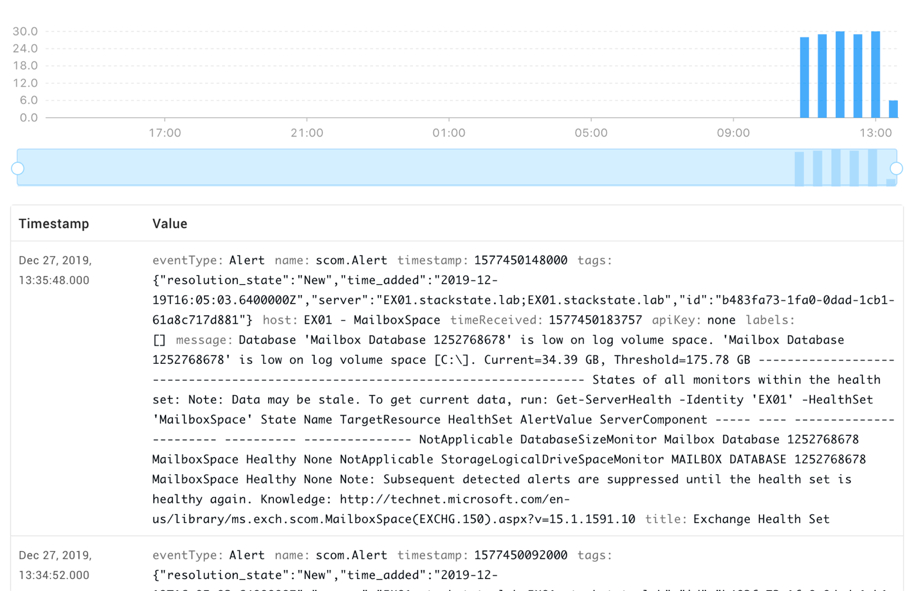
One of the most important things this integration enables is mapping the alerts of the components that are in a critical state. This allows you to get an overview of what’s wrong by checking the component’s alerts telemetry stream. For example, you can see your Microsoft Exchange server in StackState represented as a component that has relations to other Exchange services. Once you open it, you can also see other information like in which Data Availability Group (DAG) this server is, or the specific Exchange server role. This helps you to quickly determine where to look for the problem and thus quickens Root Cause Analysis (RCA).
Mapping alerts to components and watching how this affects the system chain is part of the integrations with the SCOM. In StackState, once a component goes red, the corresponding alerts from SCOM are being mapped to this component. For example, the alert in the picture shows that there is a low disk space incident for a copy of the exchange database on exchange server EX01 and therefore the Exchange server EX01 is affected.
Check out the image below.
What to do with custom SCOM management packs?
Customizing the SCOM to your needs is always challenging. For a simple override, you will have to create a new management pack. Sometimes the functionality is not in the management pack and you have to create an in-house management pack. For example: if you have a group of devices in SCOM that you would like to monitor for being 'pingable'. Then it's possible to tune the integration in StackState to include your customizations, visualize them, create a relationship between these customizations and different components in the topology, and get more value out of your SCOM customizations.
SCOM X StackState = next level monitoring
So, what value do you get when StackState is on top of SCOM? We've lined up a few of the benefits we explained above for you here:
Reduce your Mean Time To Repair (MTTR) & have a faster Root Cause Analysis (RCA)
Ingest different data sources in your IT environment together with SCOM to get more in-depth insights
Have a better Topology view on your IT environment & enrich your Full Chain view
Map alerts to components in your IT environment
Travel back in time to see when incidents started
Artificial Intelligence capabilities like predictive analytics
Could you really use this? Book a guided tour with one of our StackState experts and discover how StackState makes your life easier.


