What can AWS X-Ray do?
Amazon Web Services (AWS) X-Ray is a distributed tracing solution for AWS applications. No matter whether your application is made up of EC2 instances or microservices, AWS X-Ray helps developers analyze and debug complex applications running on AWS. With AWS X-Ray, you can understand how your application and its underlying services are performing to identify and troubleshoot the root cause of performance issues and errors. AWS X-Ray provides an end-to-end view of requests as they travel through your application. You can use AWS X-Ray to analyze both applications in development and in production, from simple three-tier applications to complex microservices applications consisting of thousands of services. For any traced request to your application, you can see detailed information not only about the request and response, but also about calls that your application makes to downstream AWS resources, microservices, databases and HTTP web API’s.
"Psst...renowned global research company Gartner has listed all Artificial Intelligence for IT Operations (AIOps) vendors in their New Market Guide. Download your free report right here!"
What can AWS X-Ray do even better after integration with StackState?
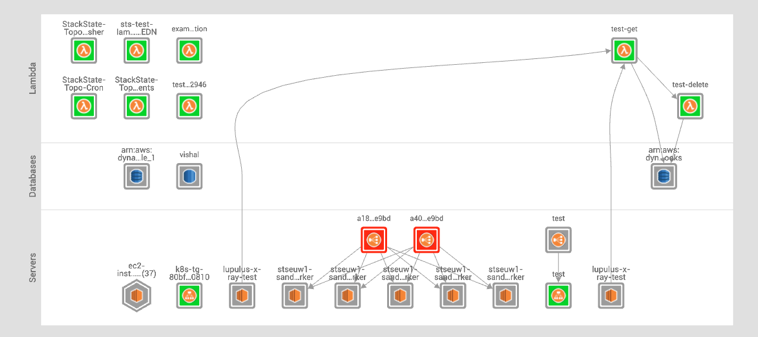
Integrating AWS X-Ray and StackState gives customers unprecedented insight into their AWS and hybrid-cloud applications. StackState extracts dependencies between AWS components from AWS X-Ray traces, giving a complete picture of the architecture and showing where issues originate. Using AWS X-Ray telemetry, StackState monitors the speed and load on connections between AWS resources.
Customers use StackState with the AWS X-Ray integration as a complete AWS monitoring solution, allowing them to resolve issues faster. Do you also want to resolve your issues faster? Book a guided tour for more information.

Why StackState?
StackState is the leading monitoring and AIOps platform for hybrid IT. The platform combines and analyzes metrics, logs, events, and data beyond typical monitoring data, like Google Analytics, CMDBs, CI/CD tools, service registries, automation, and incident management tools. The 4T Data Model® is the core of StackState's monitoring and AIOps platform and the main driver for all real-time monitoring, automation, and predictive capabilities. It combines big data, artificial intelligence, and topology visualization to instantly pinpoint the root cause of (predicted) incidents and improve business alignment. The platform helps organizations make better decisions faster and avoid high severity outages while utilizing their current IT investments. StackState's growing customer list encompasses a range of industries — from finance, telecom, to managed service providers — and includes global enterprises like IBM Global Services, Vodafone, KPN Telecom, and ABN AMRO Bank as well as local innovators, such as NS International and Schuberg Philis.
Could you really use this? Book a guided tour with one of our StackState experts and discover how StackState makes your life easier.


