A unique observability approach
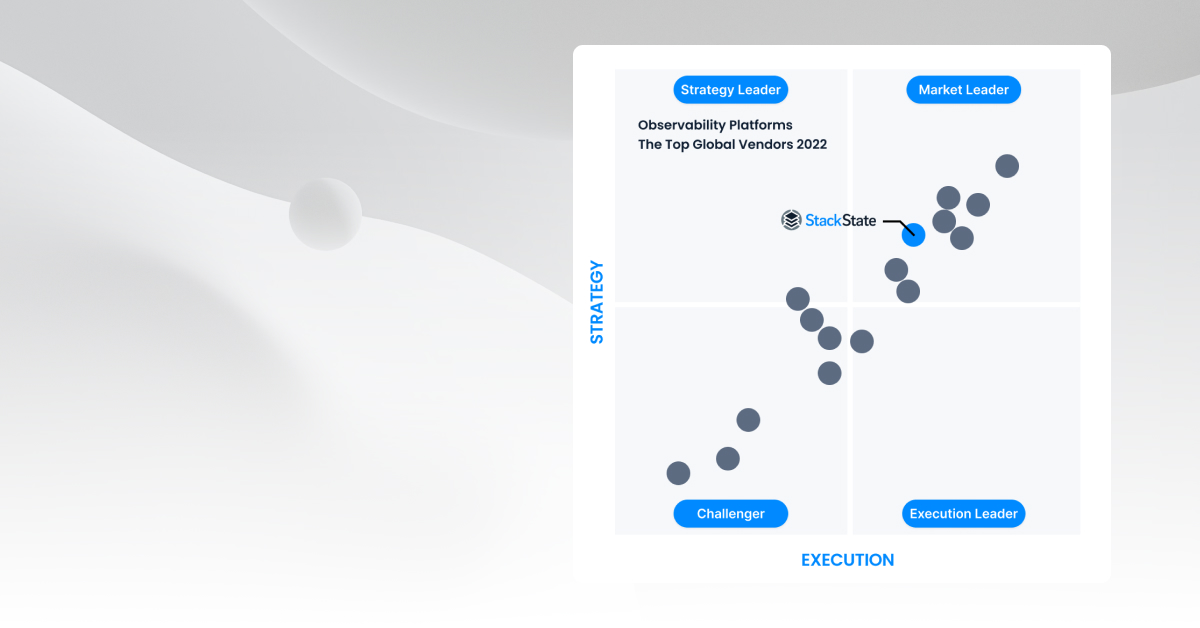
What makes us different is that we track all changes in an IT environment over time and correlate them with anomalies and issues that occur. This is all done through topology. Your IT environment is represented within our platform by a topology visualization that is a single pane of glass through which to observe your entire stack. This is a very different approach than our competitors take to solving the problem of maintaining a reliable and robust IT environment. The strong vision represented in our observability platform and our go-to-market strategy was recognized by RIA.
This post takes a closer look at some of the analysis in the report.
Observability is gaining traction, many still don’t know how to adopt it
Although the term observability has been around for a while, the market is still in the early days of adopting observability tools and practices. Professionals that have heard about observability still need a better understanding of it, in order to successfully adopt it. What is clear in the research is that observability is amongst several strategic automation capabilities necessary to have a modern digital IT operating model.
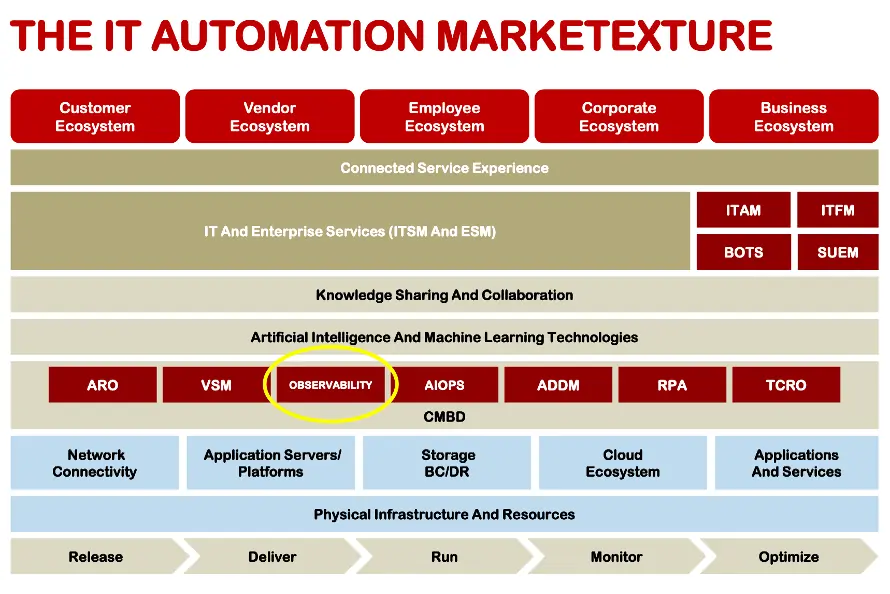
The report shows the full marketecture for automation, including observability, application release automation, robotic process automation, AIOps and others. Highlighting these technologies supports that they go hand-in-hand with maintaining a stable IT stack in the midst of dynamic change (others would call it “chaos”) that is today’s IT environment.

Four takeaways from the observability report
With the growing number of data sources existing within today’s complex hybrid infrastructure, visibility into performance is a challenge. Data is a struggle – the ingestion of it, analysis of it, correlation of it. At the same time, IT teams are overwhelmed by the growing volume of data coming at them from many tools.
15% of the audience confirms that a key priority within their strategy is to improve how data is collected.
52% of the respondents are already implementing observability, though some more extensively than others.
APM provides visibility into the performance of system components through the collection and analysis of traditional system metrics. These metrics provide the insights that help make the system observable from the outside. Starting to make a system observable through the implementation of a robust APM strategy is a first step, but this is just the beginning. Moving to observability requires a continuous process of improving system performance and work on understanding how the systems work from the inside – something that monitoring, alone, cannot do.
The four takeaways demonstrate there is a movement going on, the market is adopting it, but for many companies it is still a data struggle that needs to be solved.
A different approach to collecting and correlating observability data
StackState recognized early on the issues that the market is having in adopting observability. The VSM report shows clearly that we have solved the problem in a different manner.
StackState’s observability strategy is centered around the 4T® Data Model. This model includes topology (view all components and their dependencies, on-premise and in the cloud) with telemetry (metrics, events and logs per component, regardless of their source), tracing (insights into the end-to-end customer journey at the code level), all correlated over time (travel back to any moment in time to see what occurred within your stack).
The bottom line in the report is very clear: Our approach to observability via topology makes us unique in the vendor landscape. For organizations who are challenged with ever-changing, highly complex environments, the StackState observability platform is a great option.
To learn more about the research and the vendor landscape please download the full report.
To get more insights into what makes us uniquely powerful to solve observability challenges, play in our playground , get a demo or start a free trial.


