Observability Maturity Model Fundamentals series, Part 2
This series of 6 blogs outlines the basics of the Observability Maturity Model. Use it to identify where you are on the observability path, understand the road ahead and provide guidance to help you find your way.
Go back to or skip to: Part 1 / Part 3 / Part 4 / Part 5 / Part 6
Level 1 Overview
Are the individual components working as expected?
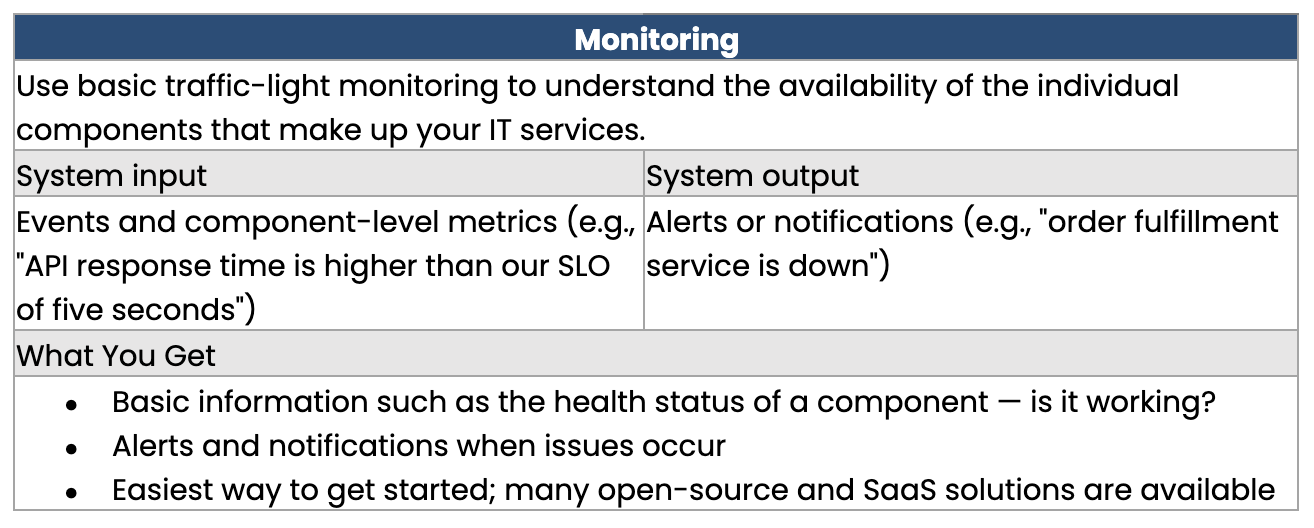
The first level of the Observability Maturity Model, Monitoring, is not new to IT. But as reliable IT system operation becomes more and more critical, the importance of monitoring continues to increase. A monitor tracks a specific parameter of an individual component in the system to make sure it stays within an acceptable range; if the value moves out of the range, the monitor triggers an action, such as an alert, state change or warning.
With traditional monitoring, sometimes referred to as application performance monitoring (APM), the use case is, “Notify me when something is not operating satisfactorily.” You can think of monitoring in terms of traffic light colors that show a component’s health status:
The component is available and healthy (green)
The component is at risk (orange or yellow)
The component is broken (red)
Monitoring looks at a pre-defined set of values with pre-defined sets of failure modes. It focuses on component-level metrics, such as availability, performance and capacity, and generates events that report on the state of the monitored value. Events are noteworthy changes in the IT environment. Though events may be purely informative, they often describe critical incidents that require action. Events may trigger alerts or notifications that arrive via various channels, such as email, chat, a mobile app or an incident management system.
Monitoring gives you basic insights into the health and status of individual components, warning you when something breaks. It is an essential first step that provides the foundation for more mature observability.

For Consideration: Level 1 Shortcomings
Level 1 gives you limited insights into the state of the overall environment: it shows you individual component health but not much information about the big picture. You get basic insights into the health and status of your services, but you don’t get actionable information to solve problems. For example, a red light indicates that a system is down, but it doesn’t help you understand the root cause of the alert so you can fix the problem quickly. Moreover, a single issue could cause a storm of different infrastructure, API and synthetic monitoring alerts. This alert onslaught can create confusion, inefficiency and delay as IT teams investigate multiple issues in their attempts to discern the real root cause of the problem.
Setting up and maintaining monitoring checks and notification channels requires a lot of manual work. The monitors are typically not connected, acting as silos of data. At Level 1, teams are answering the core question, “Is it working?” with a set of disjointed dashboards and charts. They lack depth in the data they are collecting, and they lack a holistic view of what is happening.
Once you know something is not working, the follow-up question is almost always: “Why?”, followed by “Who needs to be involved to solve the problem?” Monitoring offers very limited help to answer those questions.
At Level 1, you need to do root cause analysis and impact analysis manually, and you have a limited set of data. Investigating the sources of problems takes time.
Next Step: Observability
While Level 1, Monitoring, can detect a limited number of known types of failures, Level 2, Observability, can help you discover unknown failure modes. As you move from Level 1 to Level 2, you will gain more in-depth information that provides a better understanding of the availability, performance, and behavior of your services.


