Apache Mesos is a distributed systems kernel at the heart of the Mesosphere DC/OS and is designed for operations at very large scale. It abstracts the entire data center into a single pool of computing resources, simplifying running distributed systems at scale.
Mesos supports different types of workloads to build a truly modern application. These distributed workloads include container orchestration (like Mesos containers , Docker and Kubernetes), analytics (Spark ), big data technologies (Kafka and Cassandra ), and much more.
Mesos monitoring challenge
Mesos can help you to move resources from your cluster to the critical applications that need them, but understanding what's happening inside your Mesos cluster can be a challenge. One of the most important (and hated) tasks in systems is troubleshooting. Despite all your experience and knowledge systems will break. With the containerization of your landscape, it is even more important to know where to look to know what is failing and how it impacts critical services.
In a typical Mesos environment, you run several services like Marathon (container orchestration), Docker, and distributed applications such as HBase and MongoDB and Spark. Your tasks have dependencies on these services and on each other. StackState helps you understand and monitor these dependencies.
All of these technologies produce different types of metrics. It's not efficient to monitor and control each technology component of your cluster with a different tool. When a container suddenly breaks you will receive an overload of alerts. Endless troubleshooting will follow. How are you going to deal with this challenge?
Monitor Mesos with StackState
StackState makes it easy to aggregate a variety of relevant metrics and checks from your Mesos master, its slaves, and tasks. Just provide the Mesos API endpoint to StackState or install the agent.
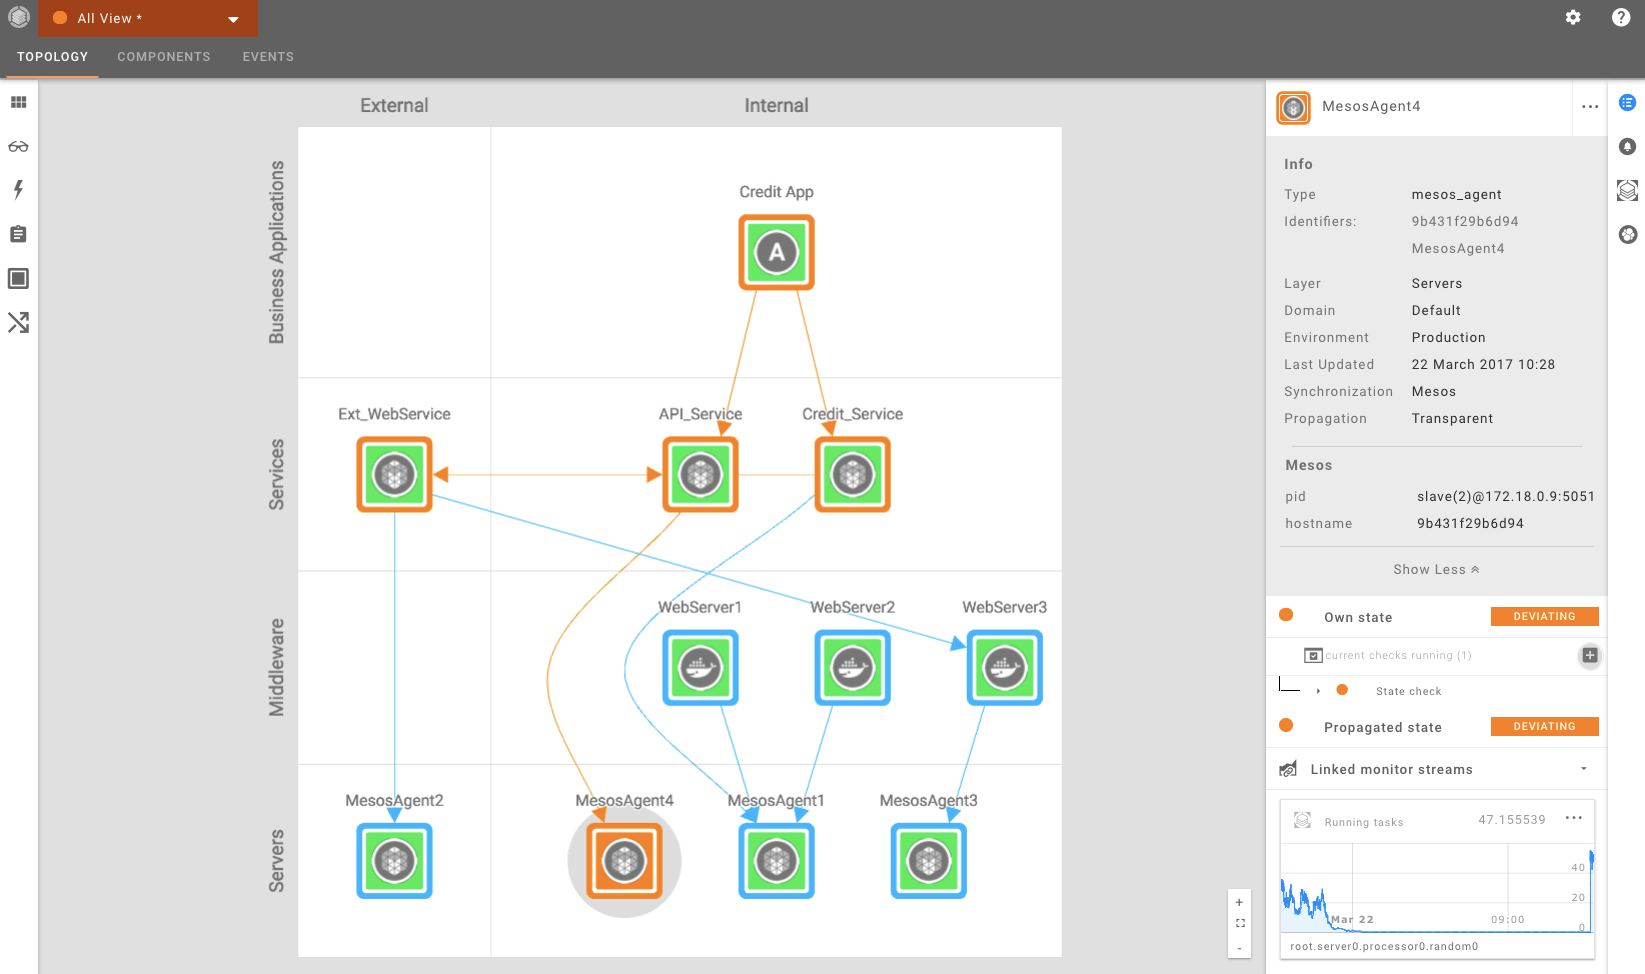
In the example below, we are showing a visualization of a containerized environment. It shows the health state of each component and its underlying dependencies. If something breaks you immediately see the cause of the problem.

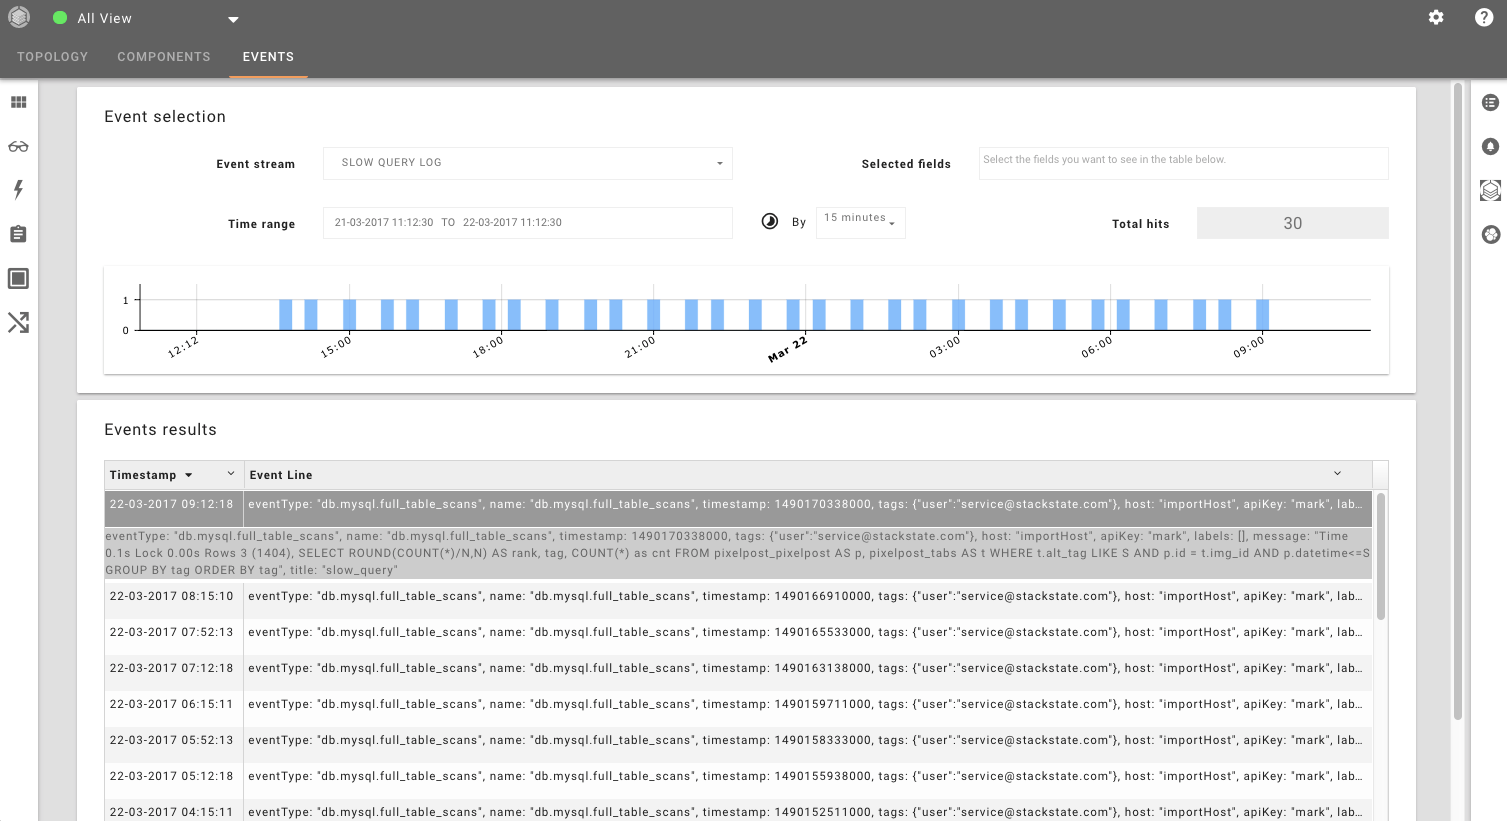
StackState is also able to analyze log files and relevant events. This helps you to quickly investigate the root cause of problems. In the example below, you see some slow queries from a database running on Mesos.

StackState does not only show and monitor all your dependencies but also has advanced analytical capabilities that offer you the possibility to reason about the whole model of your IT stack. For example, you can perform a query about which Mesos batch task will not be ready in time and could affect your primary business processes. E.g. calculating the right interest each day in time (ETA 8:00 AM) is an important process that should not fail because of one job that took too much time. StackState will notify you when problems will occur.
Conclusion
Connecting Mesos to StackState gives the ability to:
Visualize your Mesos cluster performance
Correlate the performance of Mesos with the rest of your applications
Find all tasks (including containers)
Correlate all tasks (based on connectivity between them)
Report metrics for a Mesos slave and master
Correlate all services running in Mesos with other components in your IT stack
Big Data Graph analytics
StackState offers all the advanced functionalities you need to monitor your containerized environment including automated service discovery, root cause analysis, anomaly detection, and the correlation of metrics, logs, and events in once place.


