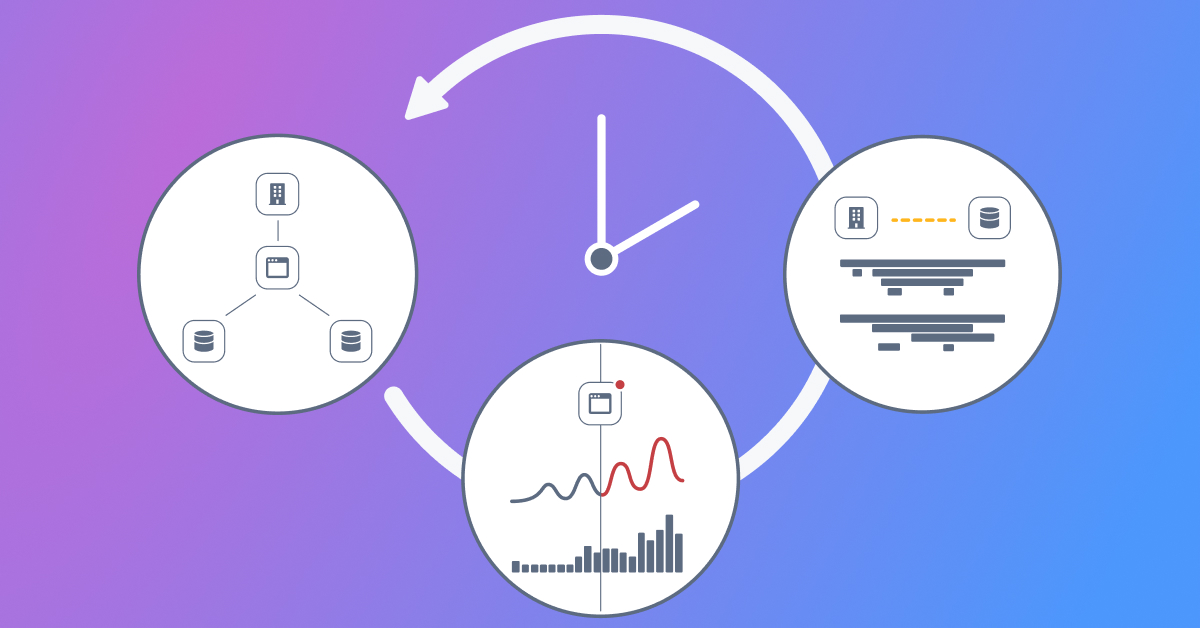
Ready to “rewind the movie” to see exactly what was going on in your stack at any moment in time? Ready to quickly go straight to the original source of the problem to solve issues faster? Check out our new infographic, Achieving True Observability With the 4Ts, to see how StackState’s unique 4T® data model correlates topology, telemetry and traces at every moment in time, to deliver real-time contextual insights into your entire IT landscape.
This is the second of a two-part infographic series on observability. See part one, The Shift to Observability. And Why It’s Time. You'll learn about the increasing demands on IT brought about by increasing complexity in IT environments - and how observability can help teams manage through it.


