So many dashboards, so little insight
It’s 2014. A major Dutch bank is struggling with performance problems in highly visible customer-facing applications. These performance problems are proving to be incredibly difficult to resolve. It’s not that there’s no monitoring data that could potentially help. In fact, there’s tons of it, all nicely displayed in pretty dashboard after pretty dashboard. But the bank’s performance problems persist, and it places an emergency call to a trusted consulting partner who sends in two of their brightest young minds to help.
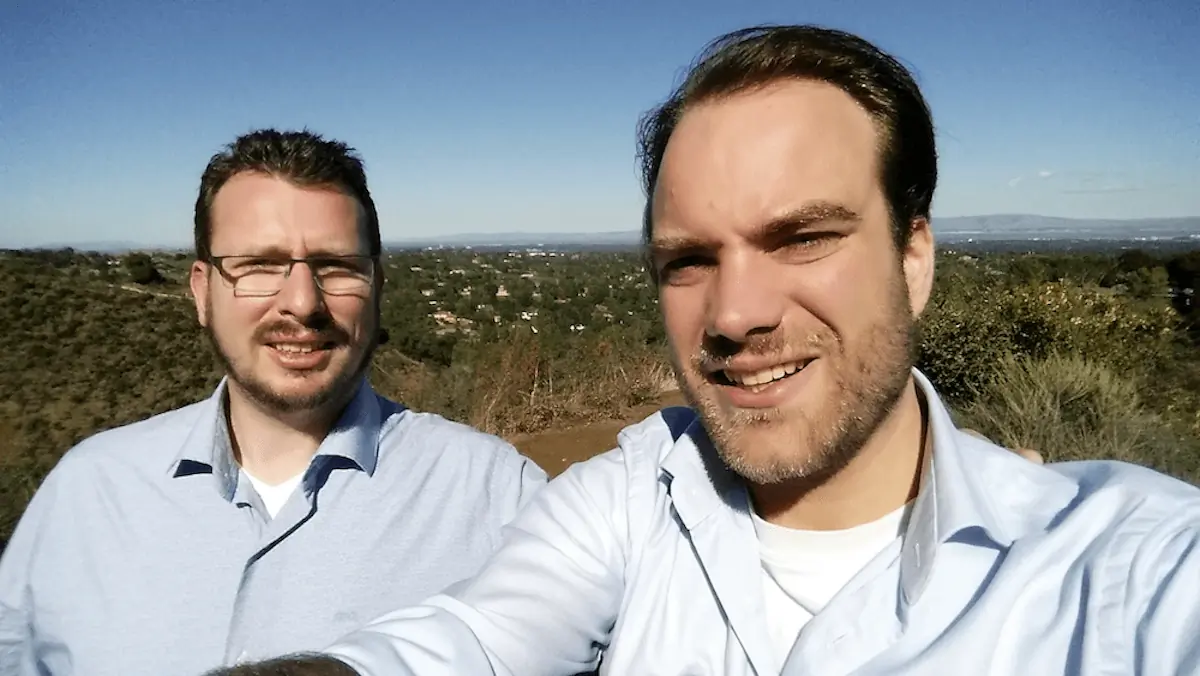
Enter Mark Bakker and Lodewijk Bogaards. It quickly became apparent to them that the problem was not a lack of data, but rather a lack of insight. All the monitoring systems created data silo after data silo, but no integrated unified view of performance. Together, they resisted the bank’s initial request to create a master dashboard that pulled from all these individual silos, because they understood that would simply be “putting lipstick on a pig” -- another pretty dashboard that masked the underlying problem.
Solving the root problem
Lodewijk and Mark knew something had to change. At the root. They needed a way to unify all the telemetry data silos produced by the various monitoring systems. They determined that topologies – the maps of the web of relationships between the many components that made up the bank’s IT environments - were what was needed. But where to get that information? They knew they needed a tool that could map the dependencies of all these different systems and environments. Moreover, they needed to see how those dependencies change over time because IT environments are constantly evolving.
The first step was to collect the telemetry data - which the bank already had. This telemetry needed to be mapped into a topology to see dependencies. That’s where the real challenge began. At first, the idea was to ask each team to draw their own topology and then link these topologies together. They would then ask these teams to keep their topologies up to date, manually. But that was going to be a lot of work. Moreover, updating topologies would mean they would lose older versions of topologies that they needed to compare against the current version when problems arose.
Building a topology that can travel back in time. From scratch.
That’s when the idea around a time-traveling topology came up. The duo thought: “what if we can create a topology, including all dependencies and relationships within an IT environment, that can travel back in time? What if we could bring topology data together from different sources - just like telemetry - and merge all that data into a single data model? So that when an issue pops up, you can scroll back in time to see what the topology looked like and find out what change caused the issue?”
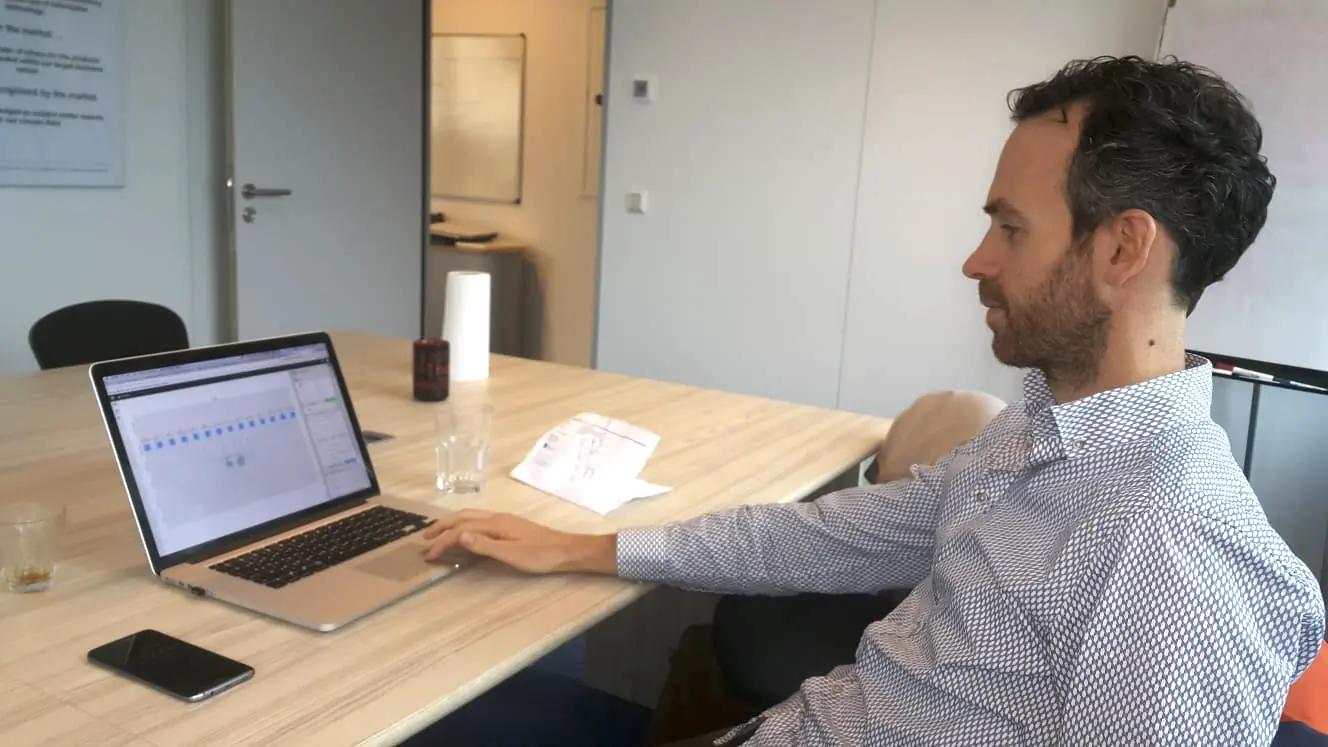
Mark and Lodewijk started building on a prototype: StackState 1.0. After the very basic version of the product became operational, they showed it to the teams within the bank and asked them if they wanted to become a design partner in the development of a production-caliber enterprise product. The response was swift, emphatic, and positive.
At that point, the duo knew they were on to something. They quickly became a trio, when they were joined by one of the best consultants within Xebia: Remco Beckers. Remco turned out to be an indispensable force in the development of this grand idea. The three of them started using a commercial graph database to build the topology. This database didn’t always cooperate the way they wanted it though - in particular, it missed the crucial time-travel capabilities they were looking for. And so, after struggling with someone else’s graph database for a while, they decided to build their own. That sounded like the obvious thing to do, and how hard could it be, right? Turns out, pretty hard: it took them three years to build.
Launching the first time-traveling observability platform
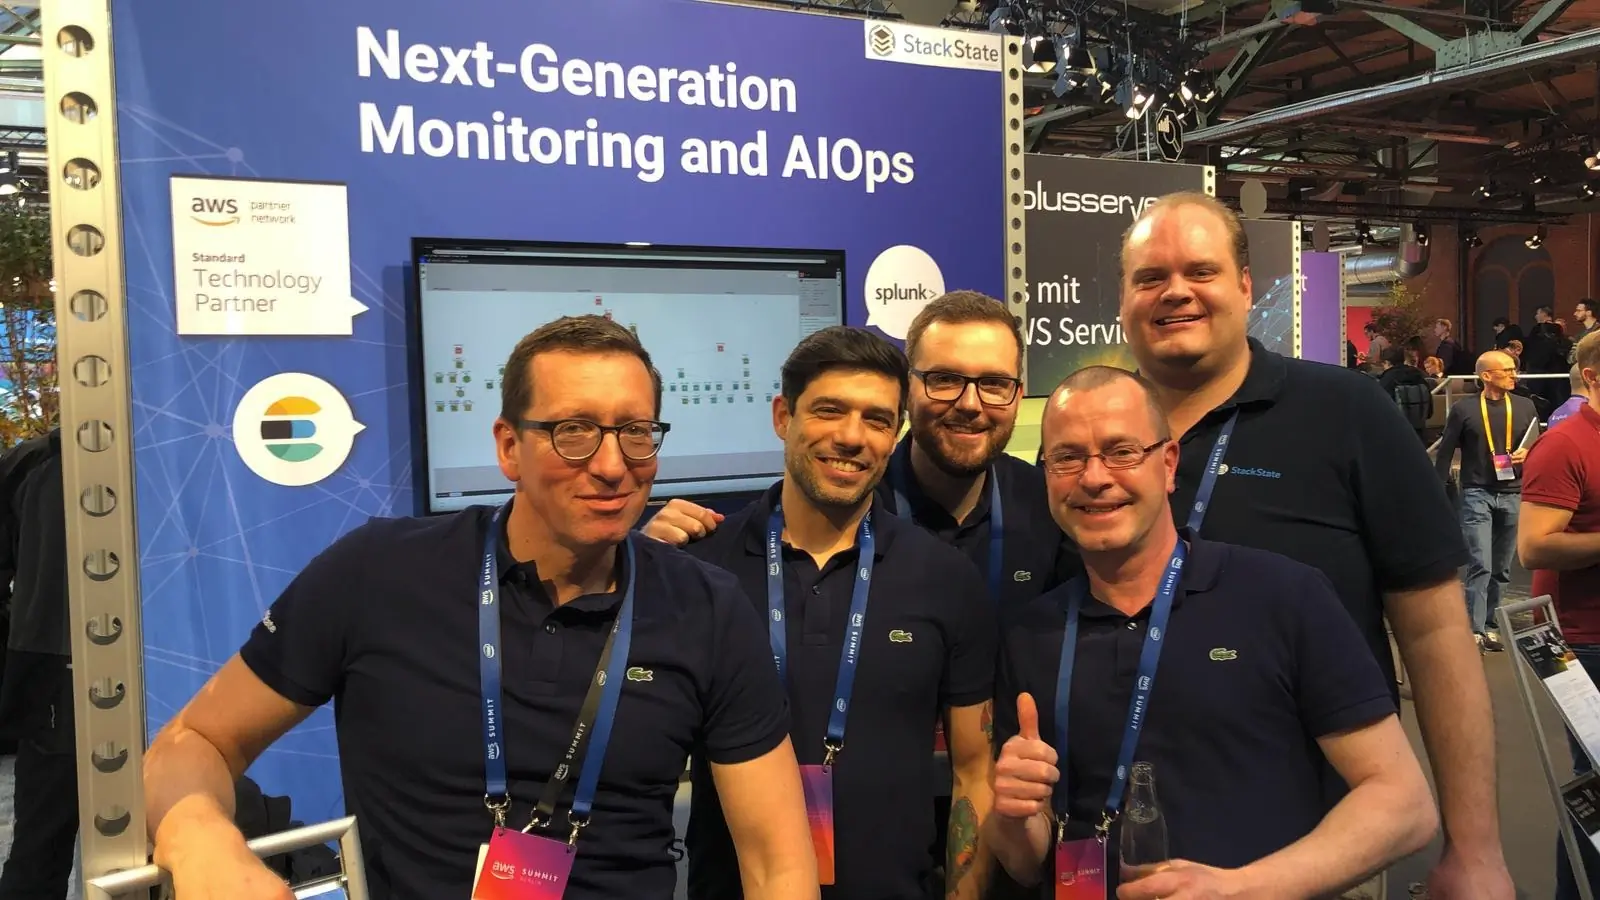
It was worth the effort. In 2017, StackState launched as the first and only observability platform with a time-traveling topology, based on a custom-made versioned graph database. That unique time-series view of topology (including all the changing relationships and dependencies and configurations) is the foundation of our integrated 4T data model that combines topology with telemetry and traces through time.
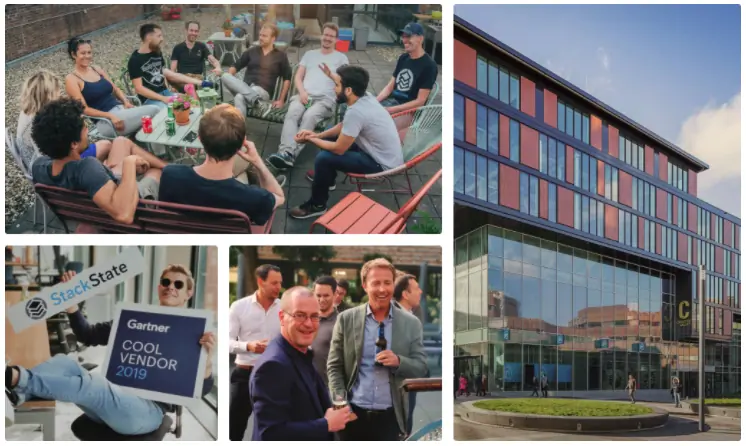
Since then, a lot has happened. StackState landed large organizations such as KPN, Vodafone, and Accenture who needed this time-traveling topology to stay on top of their ever-changing, highly complex environments. In 2019, we were recognized by Gartner as a Cool Vendor Performance Analysis. In 2021, we launched our cloud-native observability solution and were named a representative vendor in Gartner’s Market Guide for AIOps Platforms. In the meantime, the team has grown from 3 developers to a team of more than 50 employees working from all over the world (and we are always looking for great people to join us - see our current job openings) .
The journey continues
While it has been quite a journey so far with plenty of ups (and few downs) along the way, the best is yet to come. We are eager to keep shaking up the observability market because we wholeheartedly believe that time-traveling topology is a game-changer, particularly for the dynamic containerized and cloud-based systems that are where the world is headed.
Our story will continue to unfold, and we are hard at work every day building the future. Would you like to follow our adventures? Sign up for our newsletter below or follow us on LinkedIn to stay up to date.


