This blog dives into detail about one of StackState’s most unique and powerful features, Kubernetes dependency maps. Dependency maps are Kubernetes service and infrastructure maps, enhanced with real-time topology, that show dependencies between all components at any moment in time.
As someone experienced in running software in production, you understand the importance of quick resolution when disruptions occur. Unfortunately, not all issues are easily identifiable and solvable. This can present a significant challenge, but StackState's Kubernetes dependency maps provide a helpful solution. They combine all the service and infrastructure maps in your environment and augment them with a real-time Kubernetes topology, including all pods, containers and processes. They are able to show you what is running at any point in time. StackState’s maps are the most complete dependency maps you can get, and they empower the guided troubleshooting that StackState offers.
What are dependency maps?
If you want to troubleshoot an issue, the first question you should ask is, "Is it a problem with my service, or is there an external cause that is making the service misbehave?” To find the answer, you need to ask questions like:
Which services do I depend on?
Which pods are running my service?
Which services use my service, and are they behaving differently than usual (more load, more data retrieved, etc.)?
Which hosts are involved in running the pods my service runs on?
… Along with many others to help you understand what is going on in the environment.
To quickly answer these questions, you need access to dependency maps that show relationships between components and services. In some products, you will find service maps, infrastructure maps, network traffic maps, network topology maps, etc. These maps will help you identify issues faster, but you still need to navigate to a ton of different maps. In many cases, not all of the necessary maps are provided or you only get them if you pay extra.
StackState has a different philosophy around dependency maps that is much more comprehensive:
We track any type of relationship (network, infrastructure, services, deployments, etc.) so we can help you remediate an issue without the need for additional "PowerPoint architecture" knowledge.
We use eBPF, which is a lightweight way to gather dependency and metrics data. eBPF is independent of the programming languages used to build your applications.
Our maps are always up to date, so you get real-time information.
You can use our timeline to access maps at any point in time, showing how your dynamic system was composed at that moment. You can then scroll through time like you were fast-forwarding or rewinding a video to see how the system changed and how an issue progressed.
Maps are incredibly fast to access. You don't need to wait for StackState to crunch lots of data to update maps, which means your navigation is lightning fast.
Maps are easy to navigate and they highlight the information that matters, allowing you to drill down when needed.
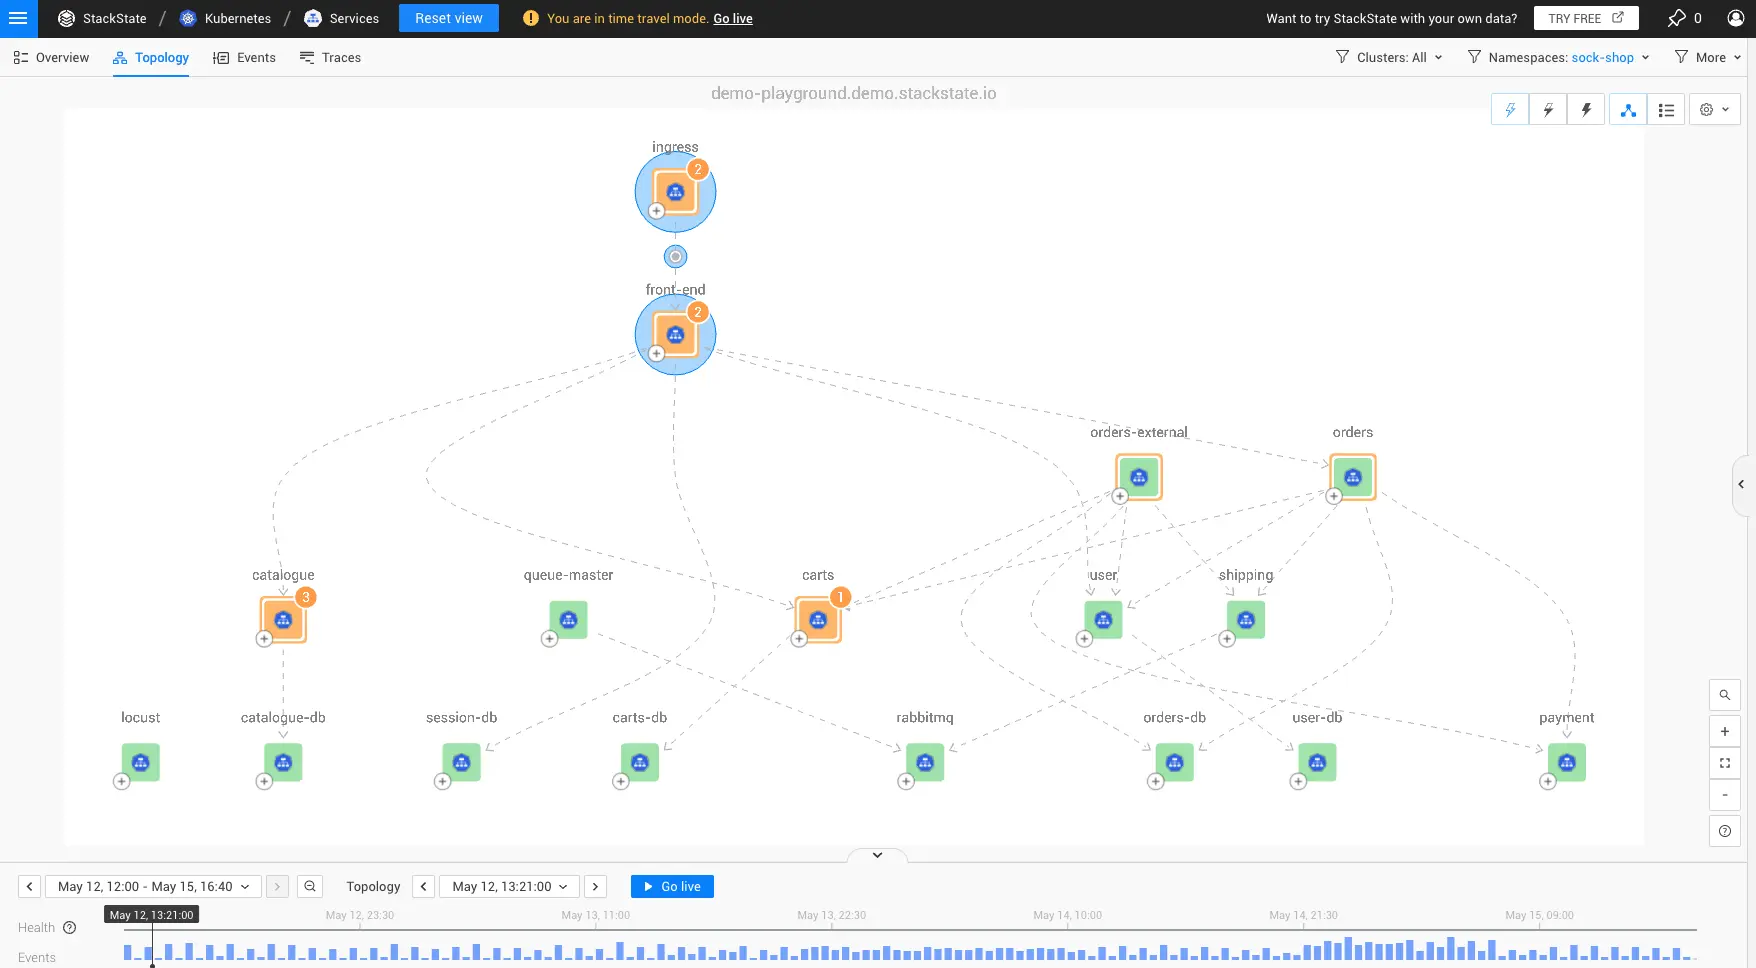
Our dependency maps show “real-time topology,” making them much broader than a simple service map in scope, granularity and their ability to display change over time.
Why does real-time topology matter?
StackState’s real-time topology includes every component, from clusters, namespaces and services to pods, containers and processes, capturing and displaying all their dynamic relations at any point in time. This detailed data enables StackState to determine – and guide you through – the correct remediation steps for any issues you might encounter when running your applications on your Kubernetes clusters.
Of course, you do not have to rely solely on our remediation guides. They are not a black box and we can show you exactly how they get their information. We provide our users with the ability to quickly investigate all details of any issue at any point in time by navigating our topology.
Here are some key features of our Kubernetes dependency maps:
Auto-grouping of related issues to help you avoid information overload
The ability to double-click to inspect (a group of) components
Display of dependencies
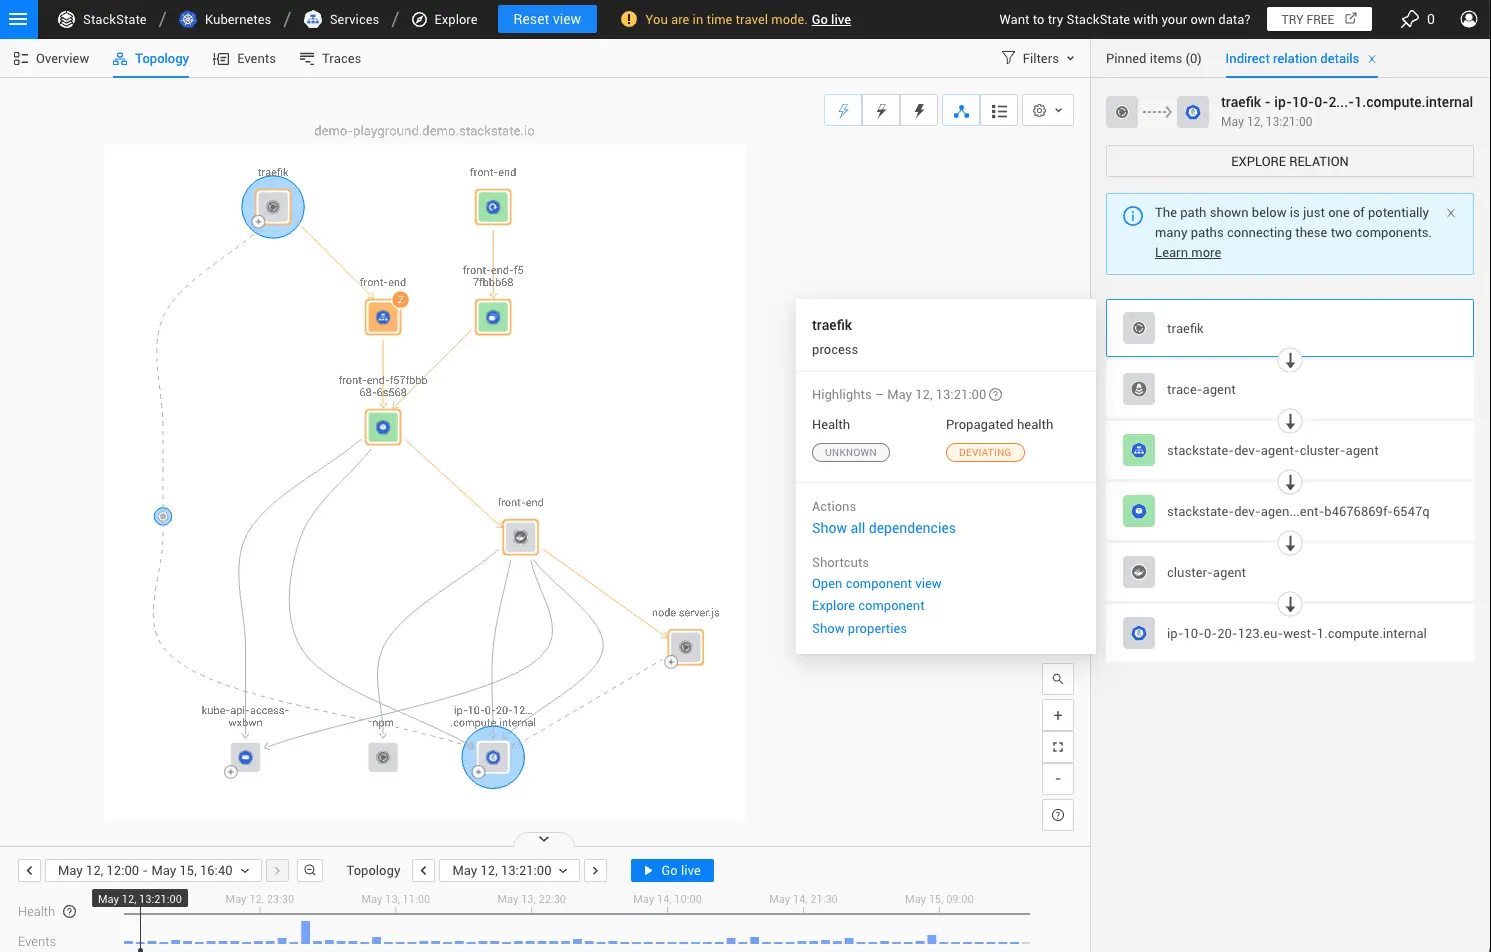
The ability to show indirect relationships between services, including all hops in-between (e.g., the service-service relationships that include the pods, services and process(es) in between).
A pop-up menu appears when you hover over a component in the topology, providing quick access to actions and an immediate overview of the state of the selected component.
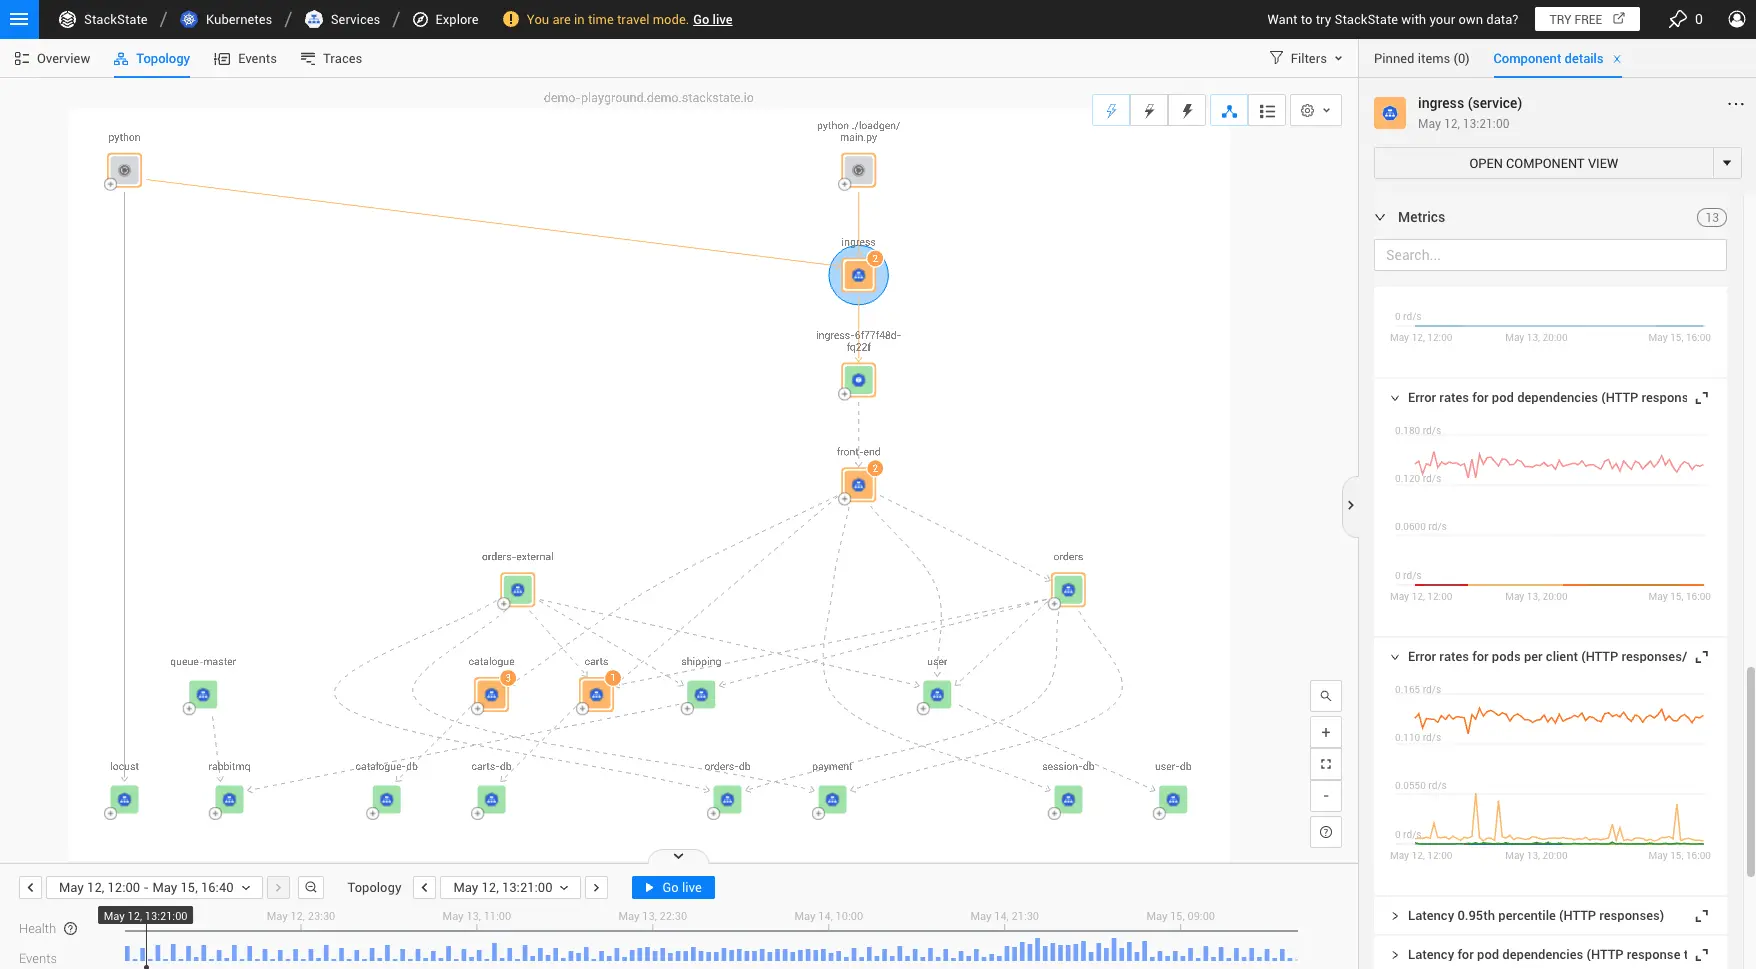
A component summary panel appears when you click on a component, showing:
The monitors that have been applied to that component, along with suggested remediation steps if something requires attention
The most important metrics for the currently selected telemetry interval, to facilitate quick troubleshooting
Quick actions you can take
A fast way to access to a component and view component details
If you want additional information about relationships, you can click the plus symbol to show any relationship that is not yet shown.
What do you need to do to get Kubernetes dependency maps?
StackState's Kubernetes dependency maps and their real-time topology are an integral part of our SaaS offering and are automatically provided with every level of the product. Our agent auto-discovers any configuration, network or infrastructural relationship and stores the data so it can be accessed at any point in time. Our different offerings do have different data retention periods, ranging from 24 hours to 36 months.
Who can benefit from StackState’s Kubernetes dependency maps and their real-time topology?
With the increased knowledge and insight provided by our Kubernetes dependency maps and real-time topology, software engineers of all disciplines can greatly improve their troubleshooting effectiveness, solve problems faster and save time. Since they can easily understand service relationships themselves, they can independently investigate system issues without bringing in other team members. In addition, StackState uses the real-time topology data to power our remediation guides for fast and independent troubleshooting.
Platform engineering teams and SRE teams get a special benefit: When something goes wrong, they need to quickly determine which team is responsible for which service so they know who to contact. They can use real-time topology to see how different services interact with each other and who owns what, so they no longer need to ask software developers how services are supposed to interact. Platform engineers and SREs can also contribute their knowledge to the remediation guides to improve the troubleshooting process for all. Experts define StackState monitors and remediation guides once, and then all engineers can benefit as they are applied automatically to all future pods.
Are you ready to experience the power of StackState's real-time topology? Try it yourself!
You can check out our real-time topology in our playground, which features a Sock Shop demo application for you to explore and discover the benefits of streamlined Kubernetes troubleshooting. With StackState's Kubernetes dependency maps and real-time topology, you'll enjoy faster, more efficient Kubernetes troubleshooting and spend less time navigating through multiple tools to find the data you need. Best of all, StackState uses this detailed topology data to determine the right steps and to advise you step-by-step how to troubleshoot an issue fast!
See for yourself – explore the playground

