Picture this: You're knee-deep in the intricacies of a complex Kubernetes deployment, dealing with a web of services and resources that seem like a tangled ball of string. Visualization feels like an impossible dream, and understanding the interactions between resources? Well, that's another story.
Meanwhile, your inbox is overflowing with alert emails, your Slack is buzzing with queries from the business side, and all you really want to do is figure out where the glitch is.
Stressful? You bet! But what if there was a 'map' — a crystal-clear, interactive, real-time map — that could unravel the dependencies and pinpoint the problem area? In today's fast-paced DevOps environment, such a map isn't just a luxury; it's a necessity.
Welcome to the world of dependency maps, the secret weapon you didn't know you needed for troubleshooting and operating Kubernetes.
What’s an application dependency map?
The average human brain can collect, organize and recall only so much data. So, keeping track of all those complex dependencies isn’t always easy. You’ll have questions and doubts: What component relies on what other component? If one crashes, what's the fallout for the business? And what if you don't have the entire cloud-native tech playbook memorized—how do you reliably connect the dots?
These are the kind of head-scratchers that can keep you up at night. But with an application dependency map in your toolkit, you’ll sleep easier. With an application dependency map in hand, you get to visualize and effortlessly navigate through all those intricate connections.
You’ll also be able to easily assess an issue’s impact, trace resources and uncover both upstream and downstream dependencies, from services and pods to containers, deployments and ReplicaSets. It's a game-changer, a unique approach to deciphering what exactly is going on.
In this blog, I’ll be sharing real-world practical ways your platform and software development teams can use these maps to successfully and easily eliminate your troubleshooting woes.
Seven ways to put application dependency maps to work
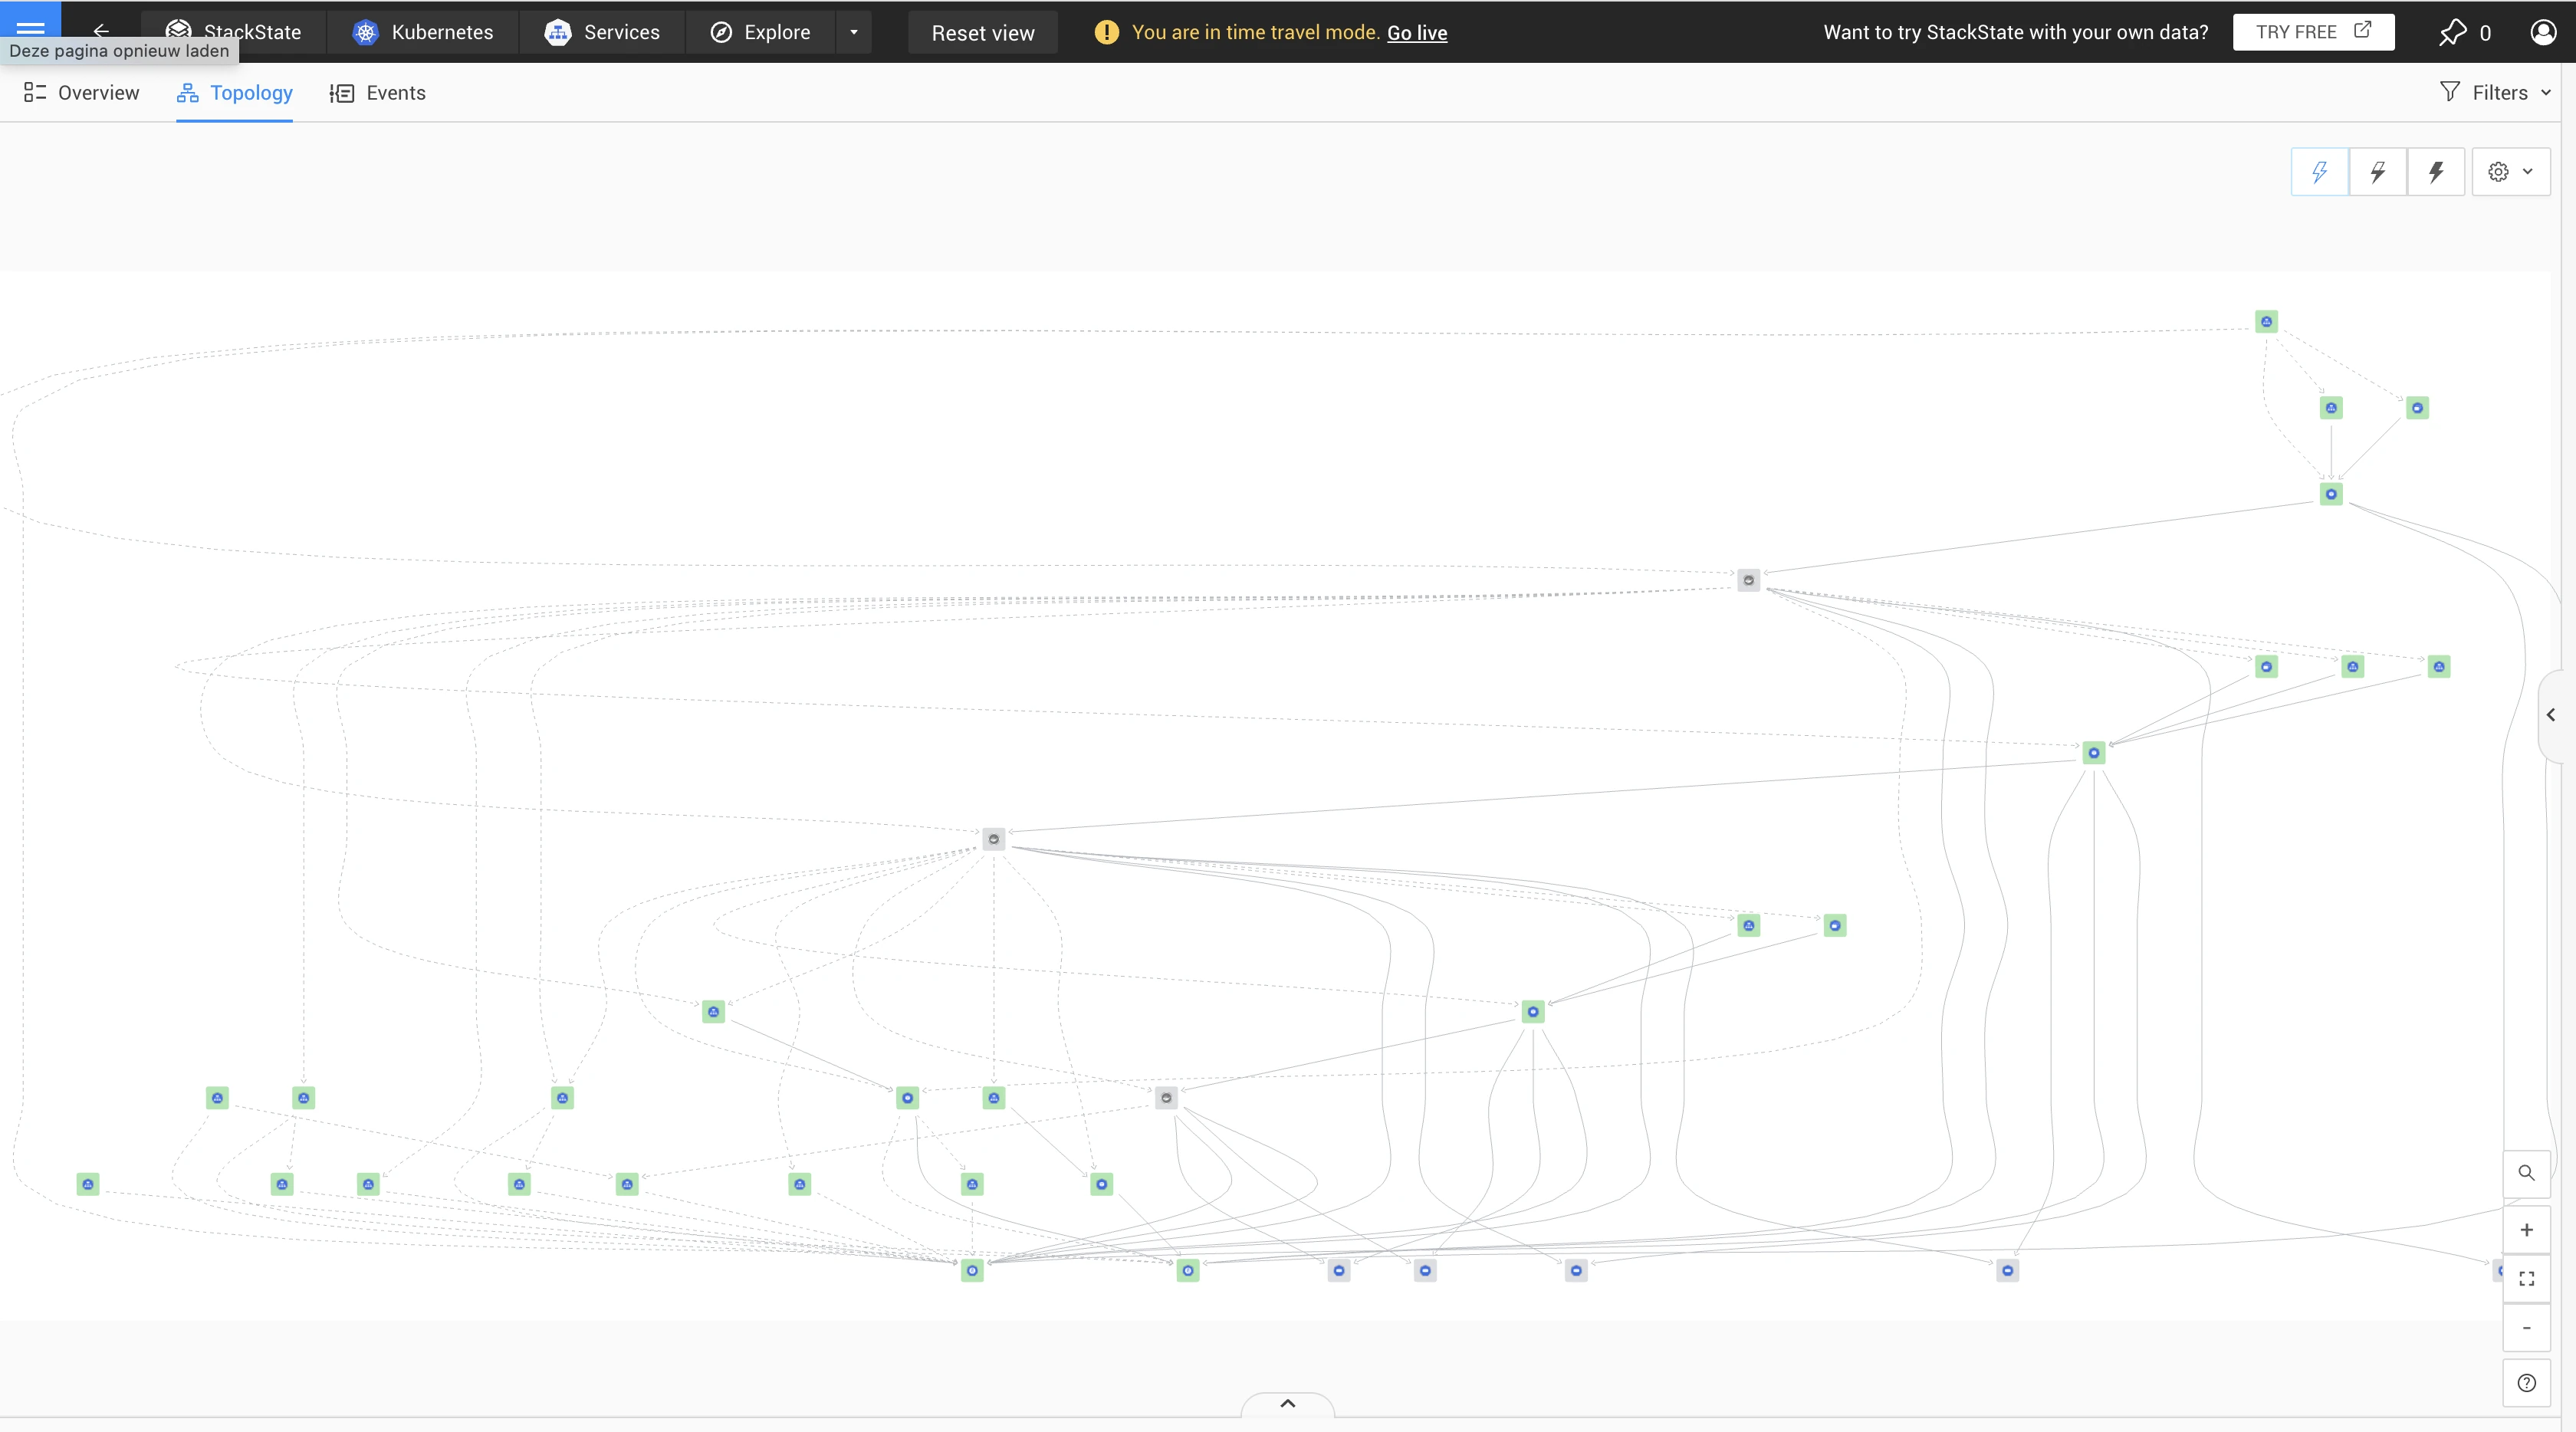
1 — The Power of a Cluster-Wide Dependency Map
You’ve heard the saying, "You can't see the forest for the trees." It perfectly illustrates a common problem in tech: getting lost in the nitty-gritty details and losing sight of the bigger picture. And that's precisely where application dependency maps come to the rescue.
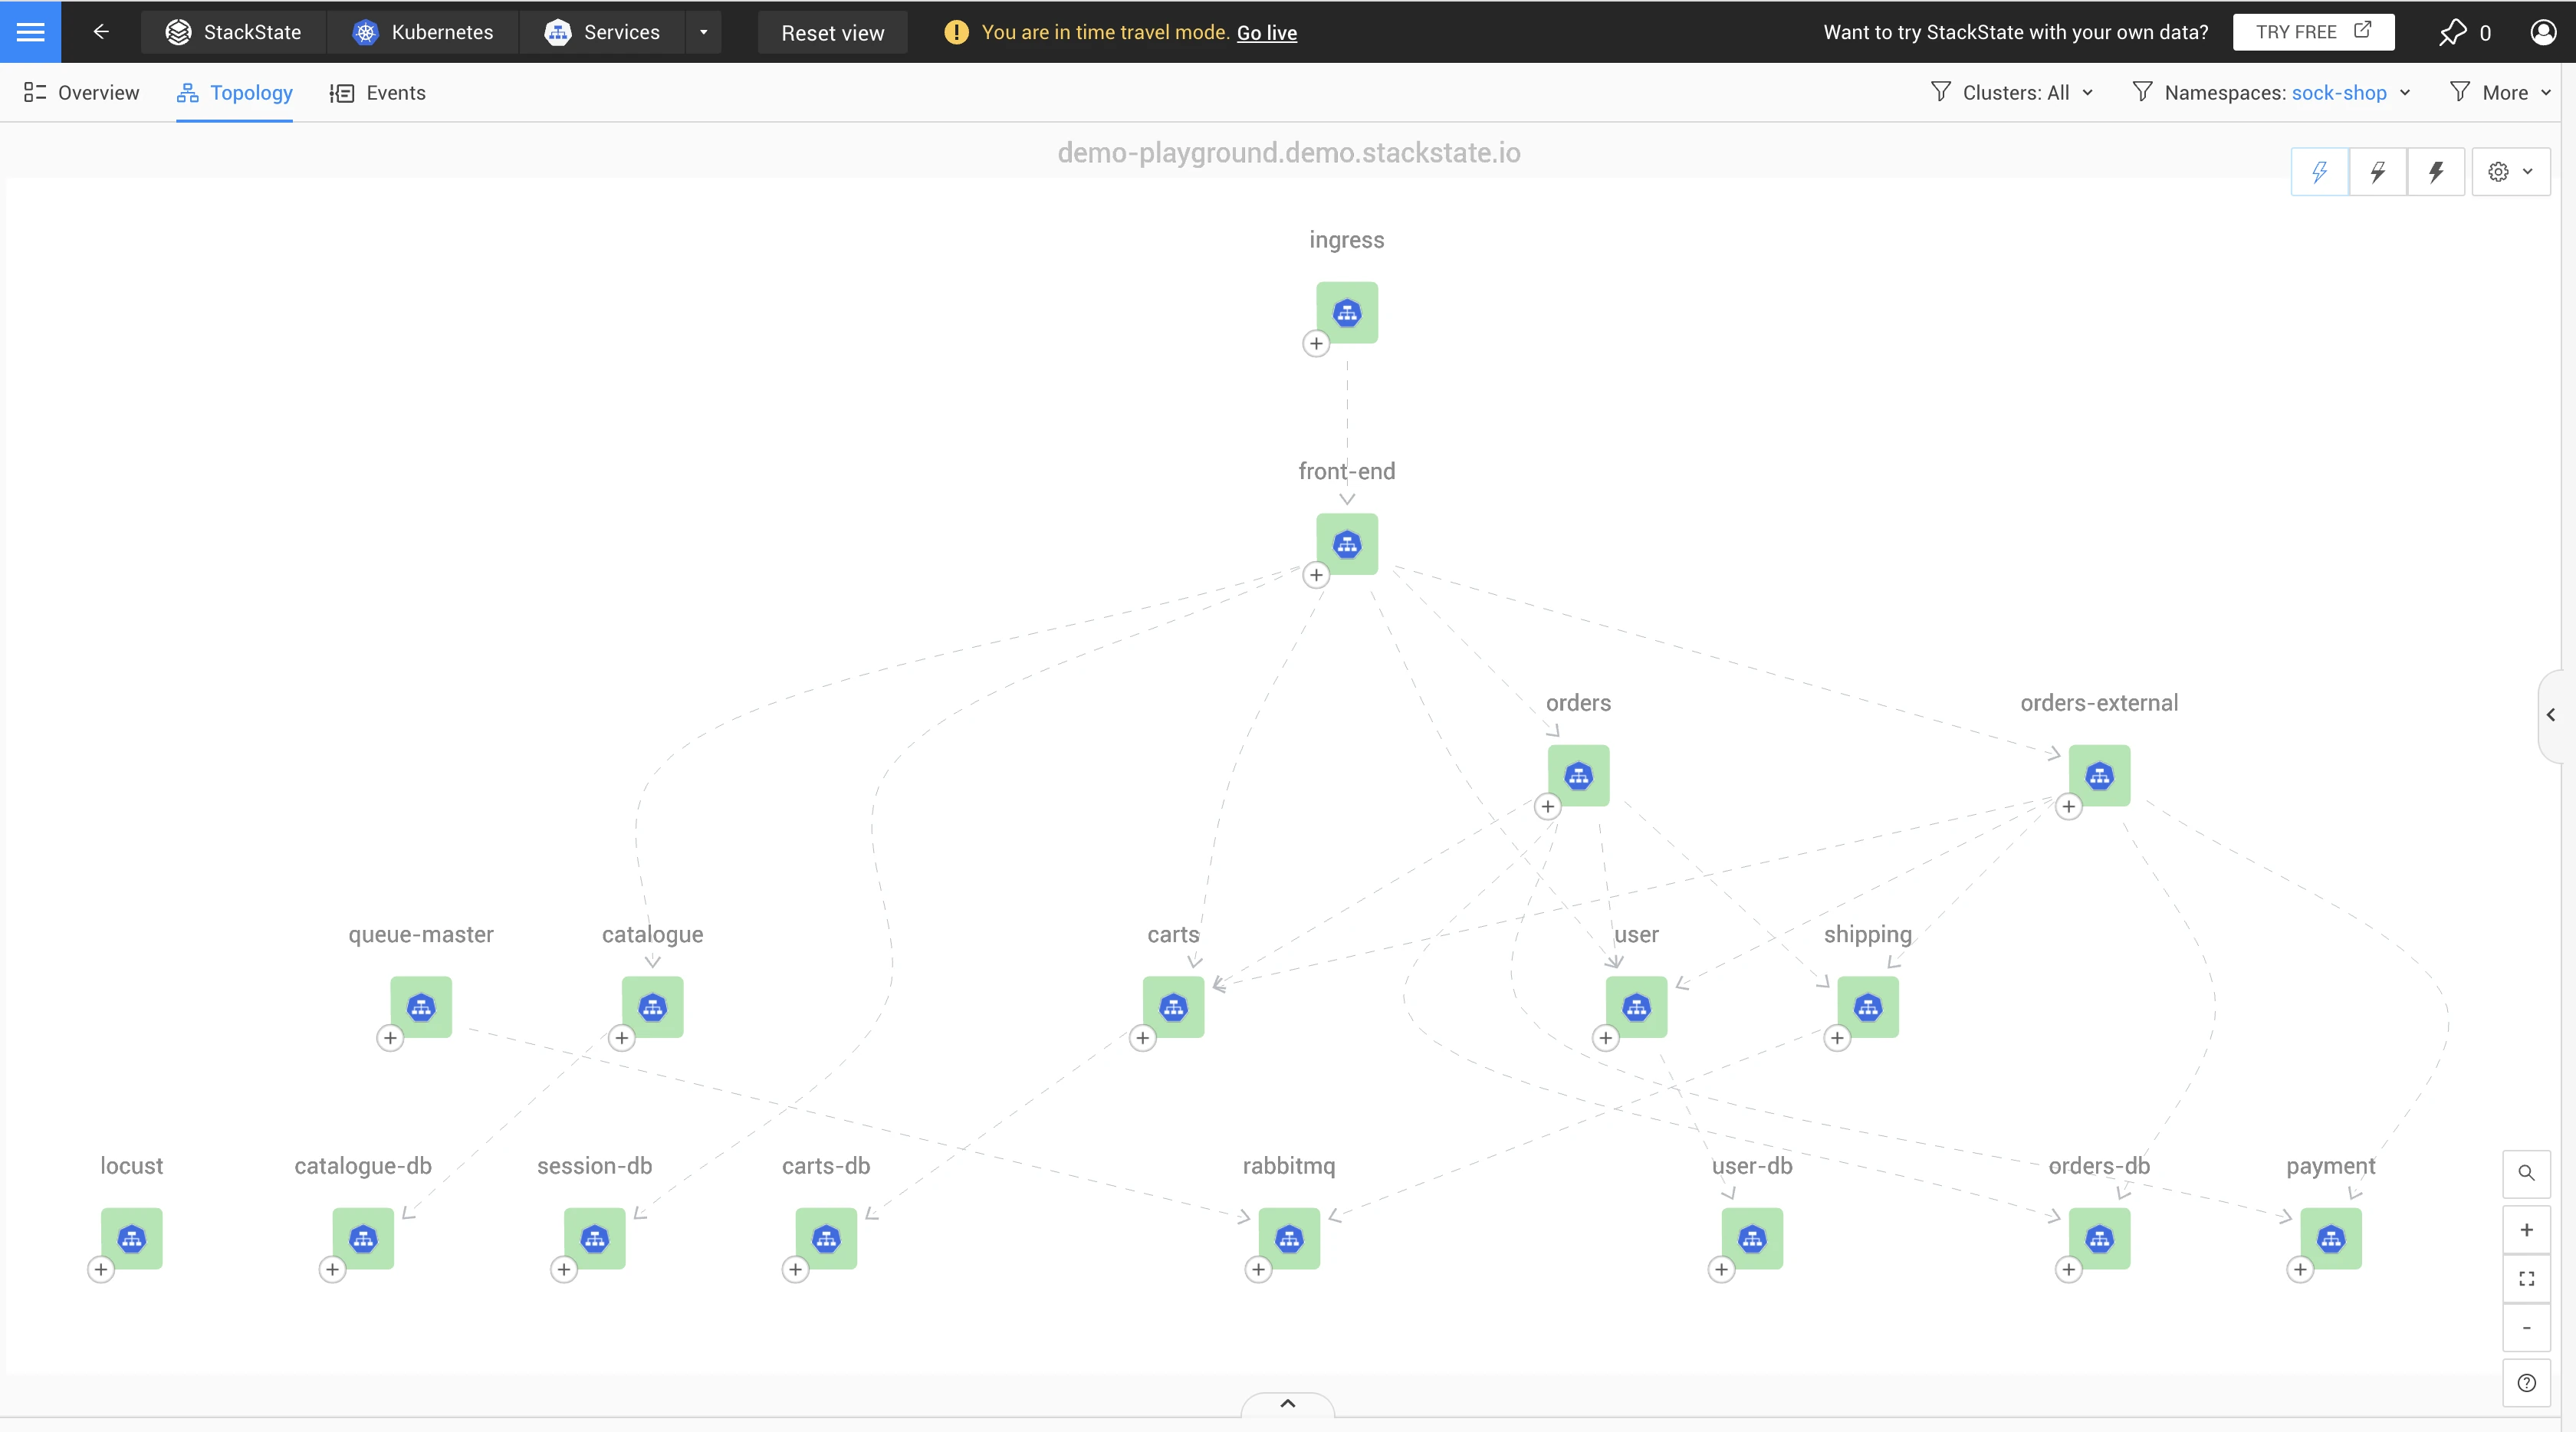
Not too long ago, I casually mentioned that we had 17 microservices interacting in our demo environment, and I thought, "Hey, this is a pretty small setup." But a colleague from a larger healthcare company was deep into a Kubernetes deployment, and he gave me a knowing smile. He said, "You might be surprised, my friend. This level of complexity can be a head-spinner for many teams just starting out on a cloud-native journey." And you know what? He had a point.
Let's break it down: 17 services, 24 pods with all their associated containers, 18 deployments, six config maps, 11 secrets, three persistent volumes and three nodes. Phew, that's a mouthful! Keeping track of all these dependencies in your head? Rather impossible!
But that's where the magic of a visual application dependency map comes into play. It's like having a GPS for your tech jungle. You don't have to be a memory wizard; you just need a map.
While many organizations stop mapping out service dependencies, StackState goes a step further. We've developed a unique topology that contains all resources. And we tame component complexity by starting with a simple reveal and then gradually unveiling the entire map, like peeling the layers of an onion.


Here's a real-world example:
An e-commerce company recently transitioned to Kubernetes and is building out its microservices architecture. A dozen services handle tasks like order management, inventory tracking, user authentication, payment processing, etc. It's all good until they need to scale. That's when they start facing latency and service failures and struggle to pinpoint the root causes.
Enter application dependency maps. With a full-scale visual map, the team quickly spots the problem: a bottleneck between the inventory and payments caused by a service responsible for tax calculations. Rectifying this issue fixes the checkout process, dramatically improving the overall customer experience.
Taking it a step further, the team set up health metrics and alerts for their services so that the moment any performance degradation is sensed, it's immediately flagged, allowing them to proactively tackle issues before they affect end-users.
2 — Driving Efficient Troubleshooting and Team Collaboration
Starting with a map is one thing, but the real magic happens when you enhance that map.
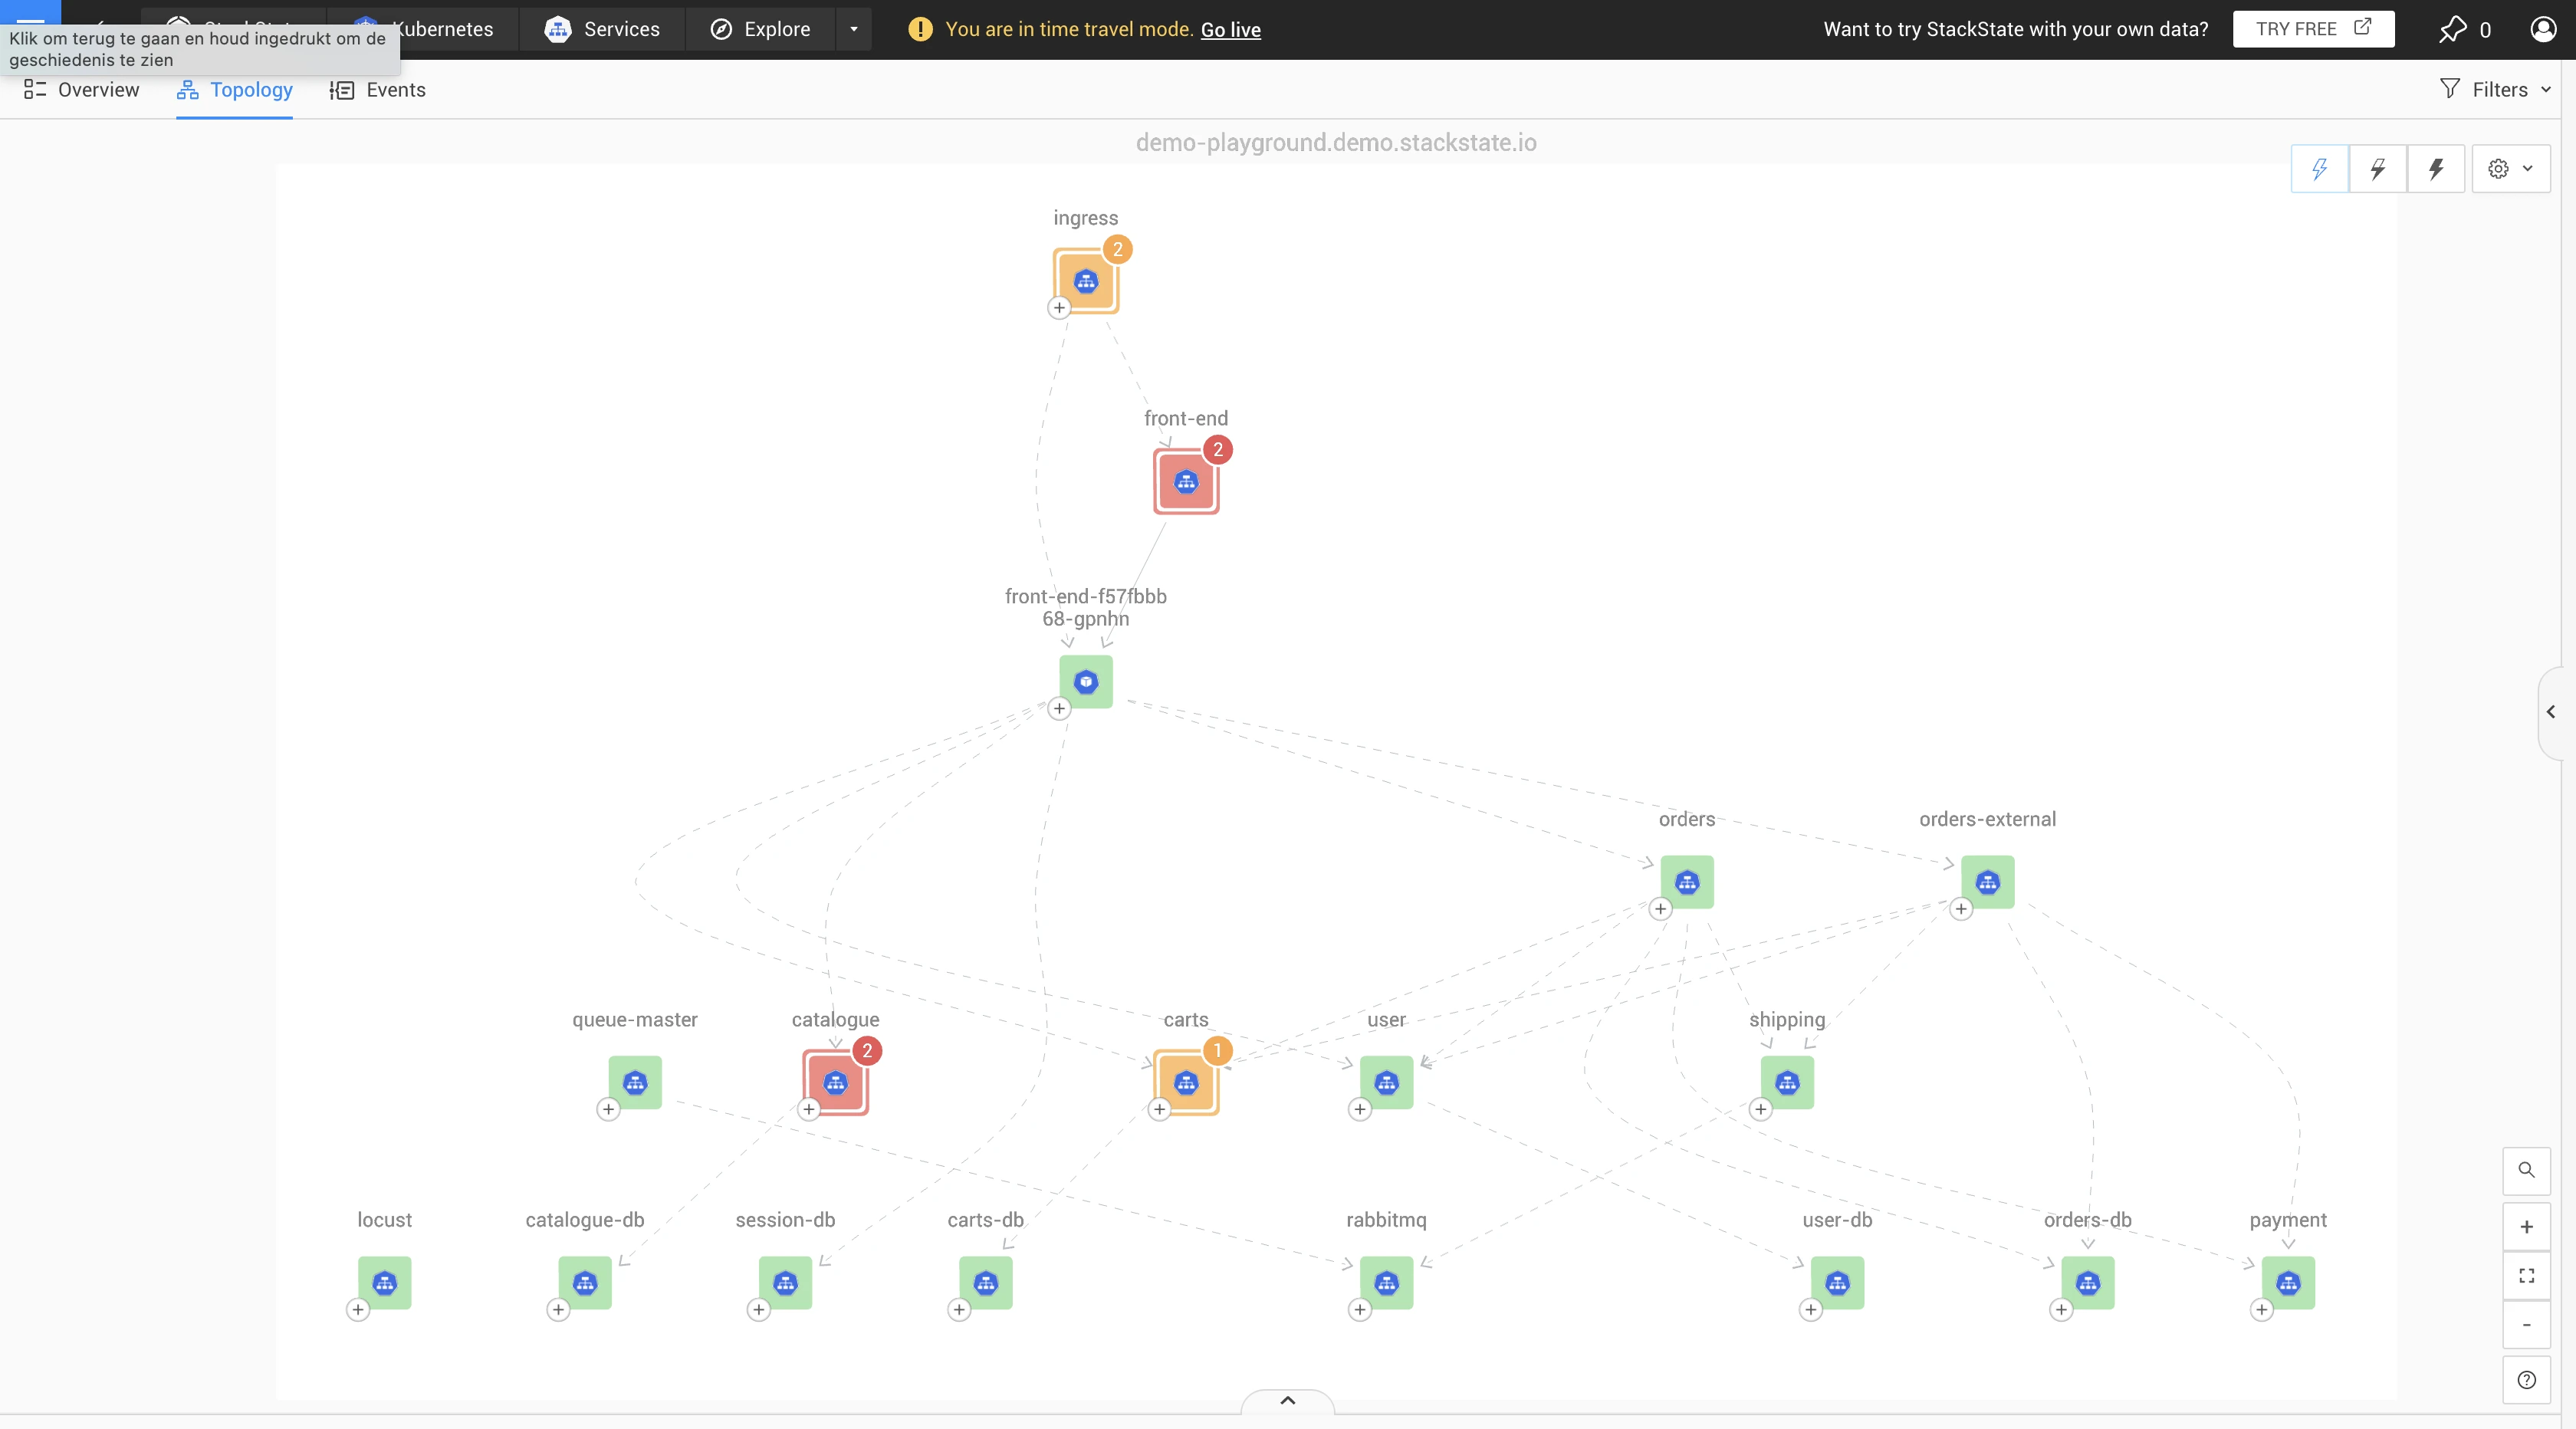
So, how do you make it even more valuable? One word: health. Adding health information to the mix is a game-changer, especially when multiple teams are in the picture and your tech landscape stretches across clusters or involves a service mesh.
Here's why health-enriched maps are a big deal:
Swift Detection: Time is of the essence. Health-enriched maps help you spot issues pronto. You don't have to play detective; the map points you in the right direction.
Precision in Action: It's not just about speed; it's about accuracy, too. Knowing where to start is half the battle.
This approach guides you in deciding which teams need to jump into action and allows engineers not directly involved in the troubleshooting to keep their eyes on the prize — innovative feature development.

3 - Understanding the Impact of an Issue
With StackState's out-of-the-box monitors, issues are quickly detected. Following the Site Reliability Engineering (SRE) handbook, the remediation process involves performing triage — understanding what's happening and assessing the issue's impact. This is where the visual map becomes invaluable. StackState offers a comprehensive application dependency map to highlight related components facing issues. Use the map to:
Identify Related Components: Understand how each resource behaves individually.
Analyze Component Behavior: Discover how the individual microservices depend on and rely on each other.
By interacting with StackState's application dependency maps, remediation teams can make informed decisions about where to start addressing an issue and know where to look first to minimize customer impact.
4 - Bridging the Knowledge Gap
Contrary to popular belief, navigating Kubernetes resources is entirely possible even without being an expert. Not every software developer has an encyclopedic understanding of every Kubernetes resource, and that's perfectly normal. However, when it comes to troubleshooting, you might find yourself diving deep into the inner workings of Kubernetes, which can be stressful if you're unsure of how things function.
Historically, approaches to troubleshooting typically involve toggling between various dashboards, each dedicated to a different resource type. This can be both time-consuming and confusing. But with StackState's application dependency map in your toolkit, you can swiftly move from one resource type to another while maintaining critical context, including time-related data, health insights and more.
This streamlined approach simplifies resource navigation and empowers even the novices on your team to troubleshoot Kubernetes quickly and effectively.
5 - Fast-Track Onboarding
If you're like many organizations, you gather around a whiteboard to provide a grand tour of your application's architecture whenever a new member joins the team.
Many of us have brains that thrive on context; we understand details better when we start with the big picture. That whiteboard drawing becomes the go-to reference, a visual anchor you revisit repeatedly, enabling you to zoom in effortlessly because the highest level is crystal clear.
Now, imagine your Kubernetes cluster with its intricate web of services and dependencies. Visual application dependency maps play the same role. Whether you're onboarding new team members or navigating a rapidly evolving landscape where service interactions change faster than you can keep up with, the dependency map becomes the first instrument to reach for.
Sort of like a ready-to-use compass, StackState's application dependency maps help you make sense of the complexity, empowering your team to understand, troubleshoot and innovate confidently.
6 - Identifying Weak Links to Drive Driving Efficient Diagnosis
Integrating telemetry data into your application dependency maps takes the art of troubleshooting and monitoring to an entirely new level. Imagine a world where you not only see how components are interconnected but also receive real-time metrics concerning the performance and health of each element, all within a single, consolidated view.
These maps deliver both technical and functional metrics right alongside the architectural layout. Whether it's insights into latency, error rates or business-specific Key Performance Indicators (KPIs), having these metrics available at the component level is nothing short of invaluable for gaining an in-depth understanding of your application's inner workings.
With telemetry-enriched maps at your disposal, you're not merely detecting issues; you're diagnosing them on the spot. This capability empowers you to make rapid, data-informed decisions that keep your operations running smoothly and efficiently, ensuring a seamless customer experience.
7 - Driving Full-Picture Understanding by Exposing Hidden Layers
Complex applications often comprise multiple layers of interaction, including service meshes, services, pods, containers and processes. While it's crucial to grasp these intricate connections for thorough troubleshooting, displaying all these elements on your map can sometimes introduce considerable noise, making it challenging to pinpoint issues effectively.
This is where the concept of mapping indirect relationships comes into play. It's not just about visualizing direct interactions but also understanding the indirect connections. By leveraging the capability to visualize not just direct interactions but also indirect relationships, you maintain a full understanding of the ecosystem without getting lost in the details.
Combined with the ability to drill down into the finer points as needed, this bird's-eye view allows for a robust, holistic understanding that is invaluable when diagnosing complex issues. It's all about striking the right balance between the big picture and the finer details for efficient troubleshooting and issue resolution.
Application dependency maps: The essential tool for K8s troubleshooting
In the dynamic world of Kubernetes, an application dependency map isn't just a nice-to-have; it's an absolute necessity. Whether you're a seasoned Kubernetes pro or just starting your journey, application dependency maps provide a 360-degree view that can turn the most complex labyrinth into a navigable city. They go beyond enhancing your understanding; they empower you to take action, effectively converting raw data into actionable insights.
StackState's application dependency mapping capabilities are built for ease of use and depth of insights, setting us apart in a competitive landscape. Powered by deep eBPF-based integration, our solution boasts zero-configuration deployment, making it incredibly easy to deploy without altering your existing cluster architecture. Best of all, this simplicity doesn't come at the cost of functionality; it's designed to deliver powerful results.
So, why settle for less when you can have the complete picture? Explore how StackState can help with all your K8s challenges — whether it's pinpointing issues or orchestrating effective solutions. Take control of your Kubernetes operations with StackState as your trusted ally.
What’s next? Read our recent blog on StackState's application dependency maps and real-time topology. Or take us for a test run and explore our playground !


