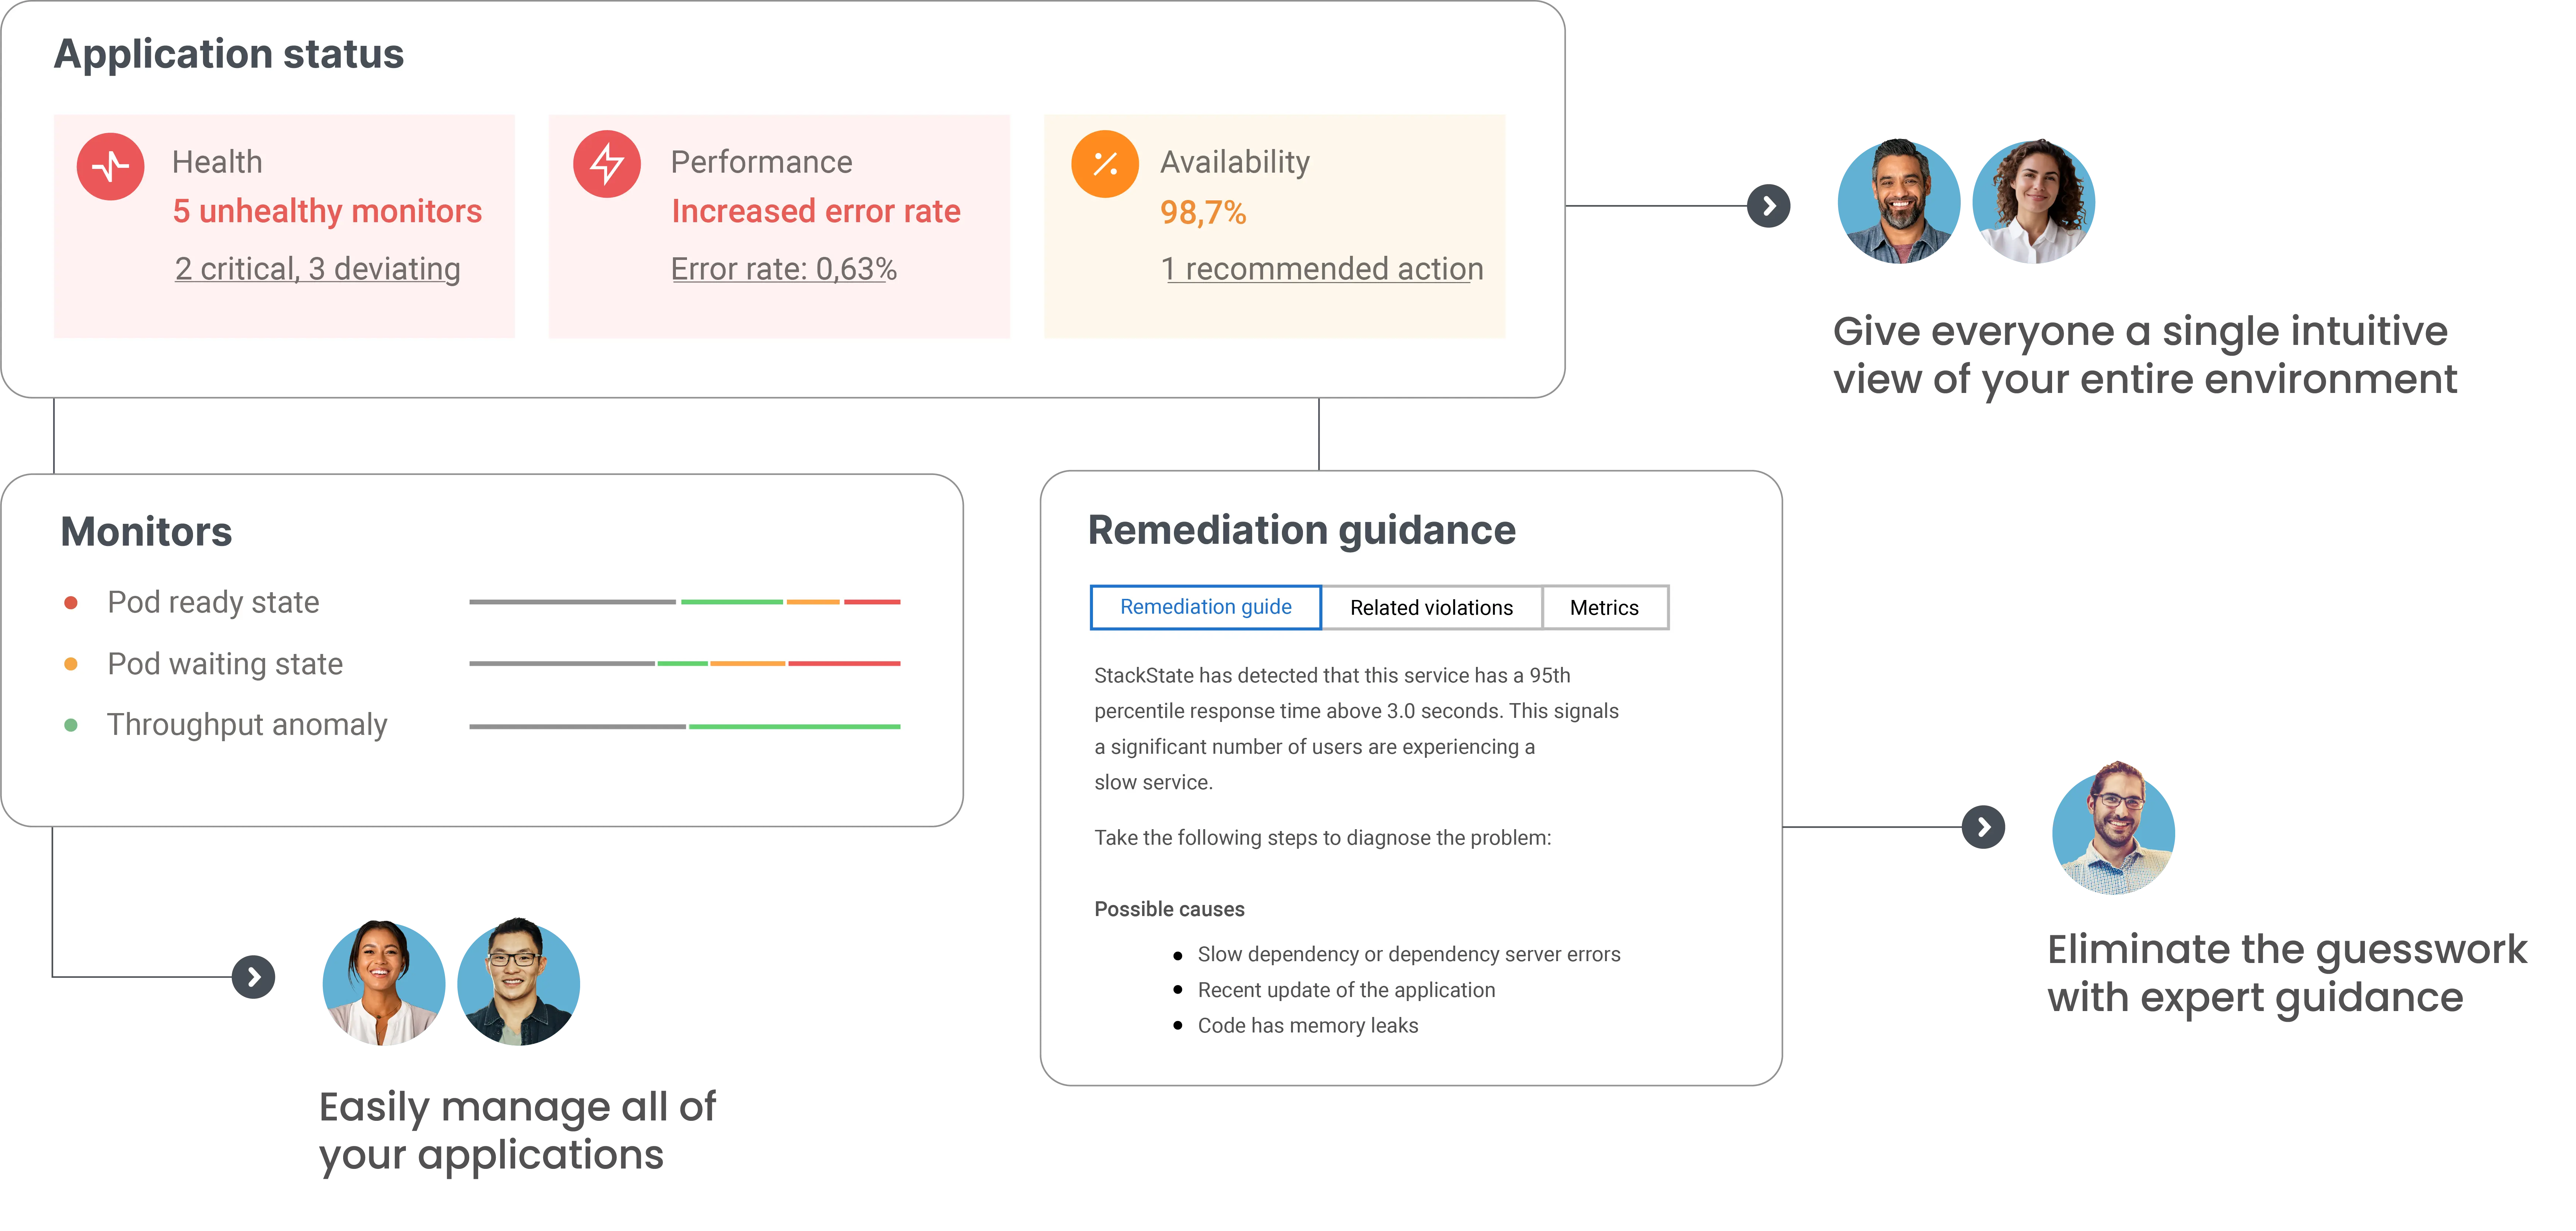
Provide end-to-end business app
observabilityView app health across every team and discipline
Resolve issues fast with expert tips and recommendations
Power your teams with
better full-stack observability
Optimize performance • Accelerate troubleshooting • Ensure reliability
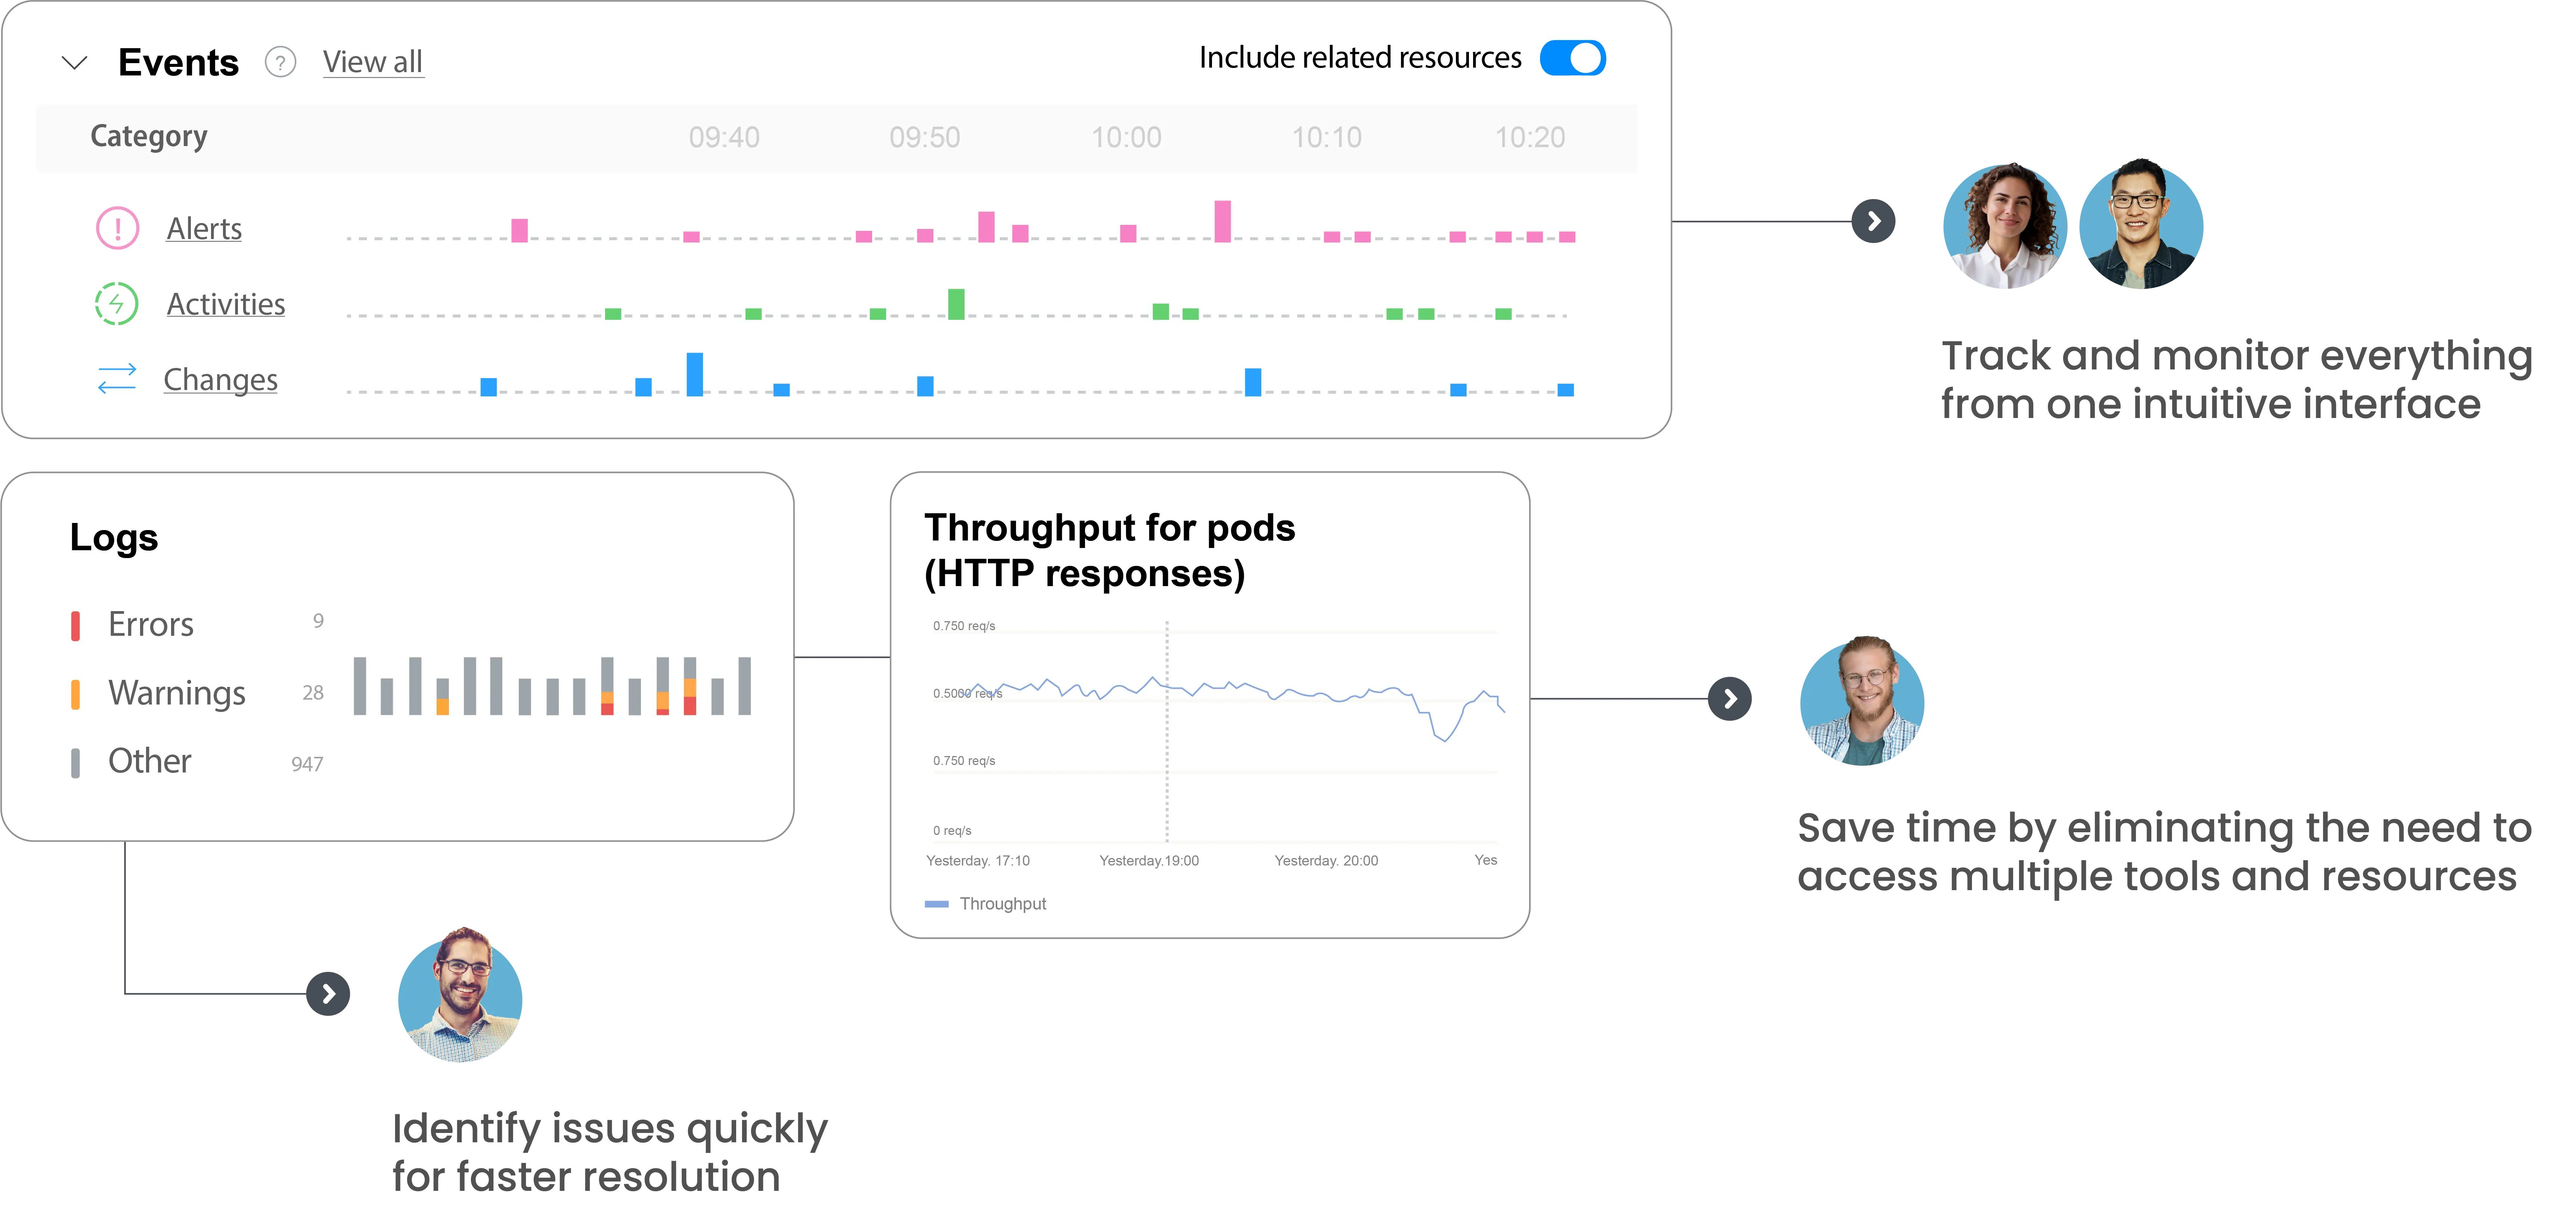
Out-of-the-box observability, expert guidance, and actionable insights — all in one intuitive interface.


Better teamwork and better apps,
thanks to better observability


Head of Platform
Business and IT Directors
Lead better

Platform Engineers
Control Room Engineers
Operate better
Observe application reliability with real-time SLIs
Get immediate alerts by text, email, Slack, etc.
Troubleshoot effectively with step-by-step playbooks

Site Reliability Engineers
Developers
Build better
Get 360° observability and remediate in under 5 minutes
Streamline processes with a DevOps-centric approach
Provide secure access to observability data


Full-stack observability to better navigate today’s complex systems
Kubernetes Troubleshooting
Easily operate, optimize and troubleshoot your K8 applications so your teams can deliver more value with less effort.
Find and fix issues fast with an expert knowledge base
Get 360° observability without switching between 5-7 tools
Diminish downtime and innovation interruption
End-to-End Observability

Get a comprehensive and actionable view of your entire stack, including integrations like OpenTelemetry and Splunk.
Ensure your services are reliable and resilient
Proactively prevent major issues from affecting users
Drive innovation and cross-team collaboration
Application Performance Monitoring
Gain the insight you need to detect anomalies, pinpoint root causes, and optimize app performance across your full stack.
Identify and remediate issues proactively
Understand all dependencies and impacts
Instantly search and filter traces for better analysis
- 84%decreased MTTR
- 85%increased productivity
- <5 minutesto resolve an issue
- 80%cost reduction
- 65%fewer outages
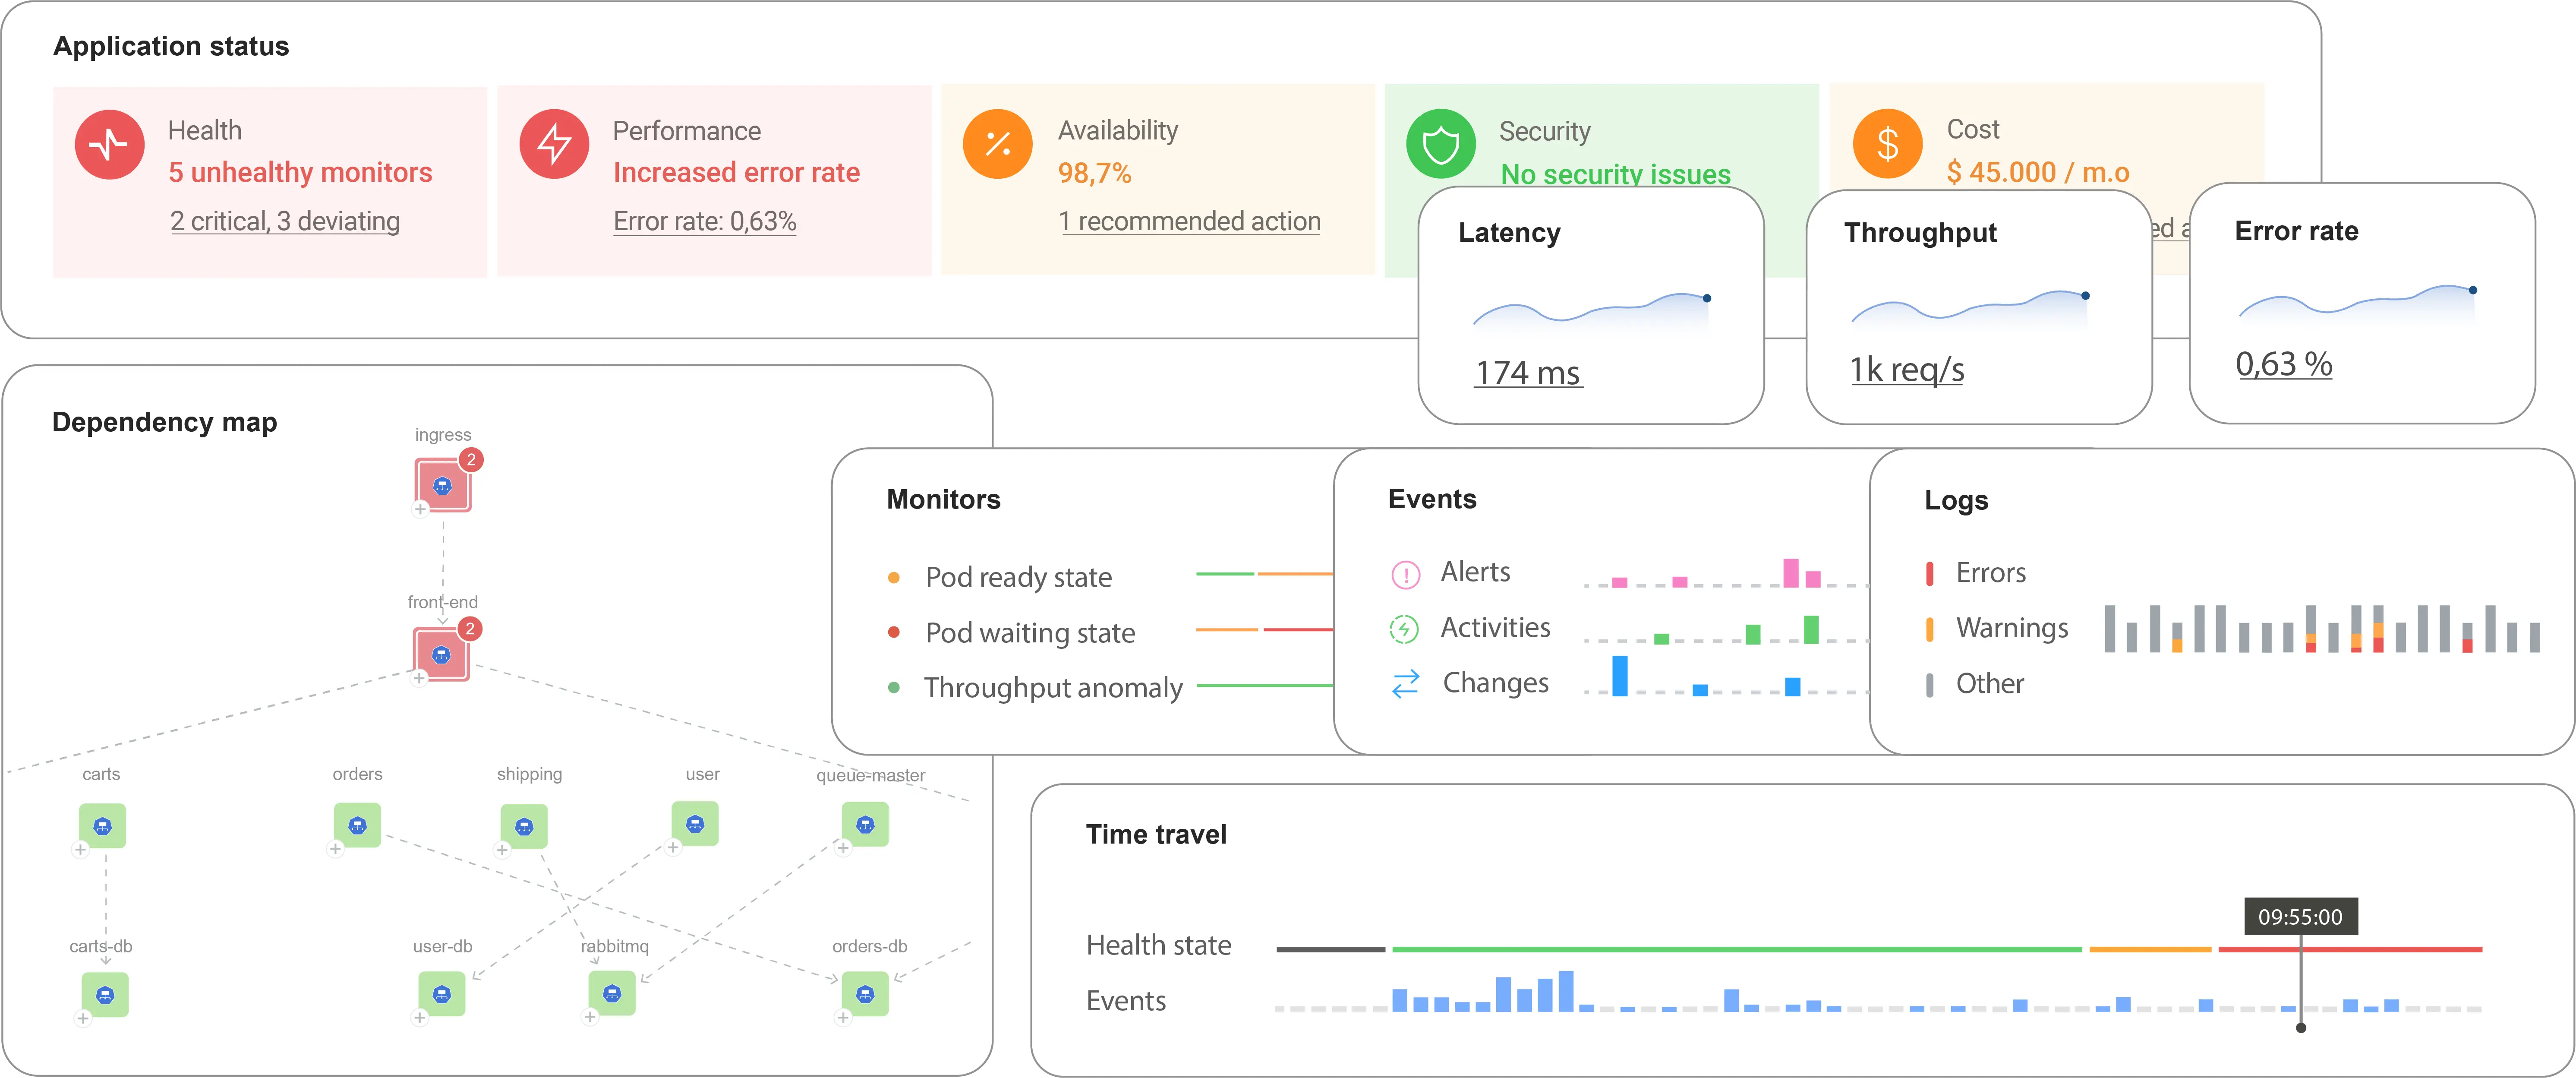
A unified, contextual view of everything you need to know
Uncover and remediate issues in minutes — before they impact your customers.
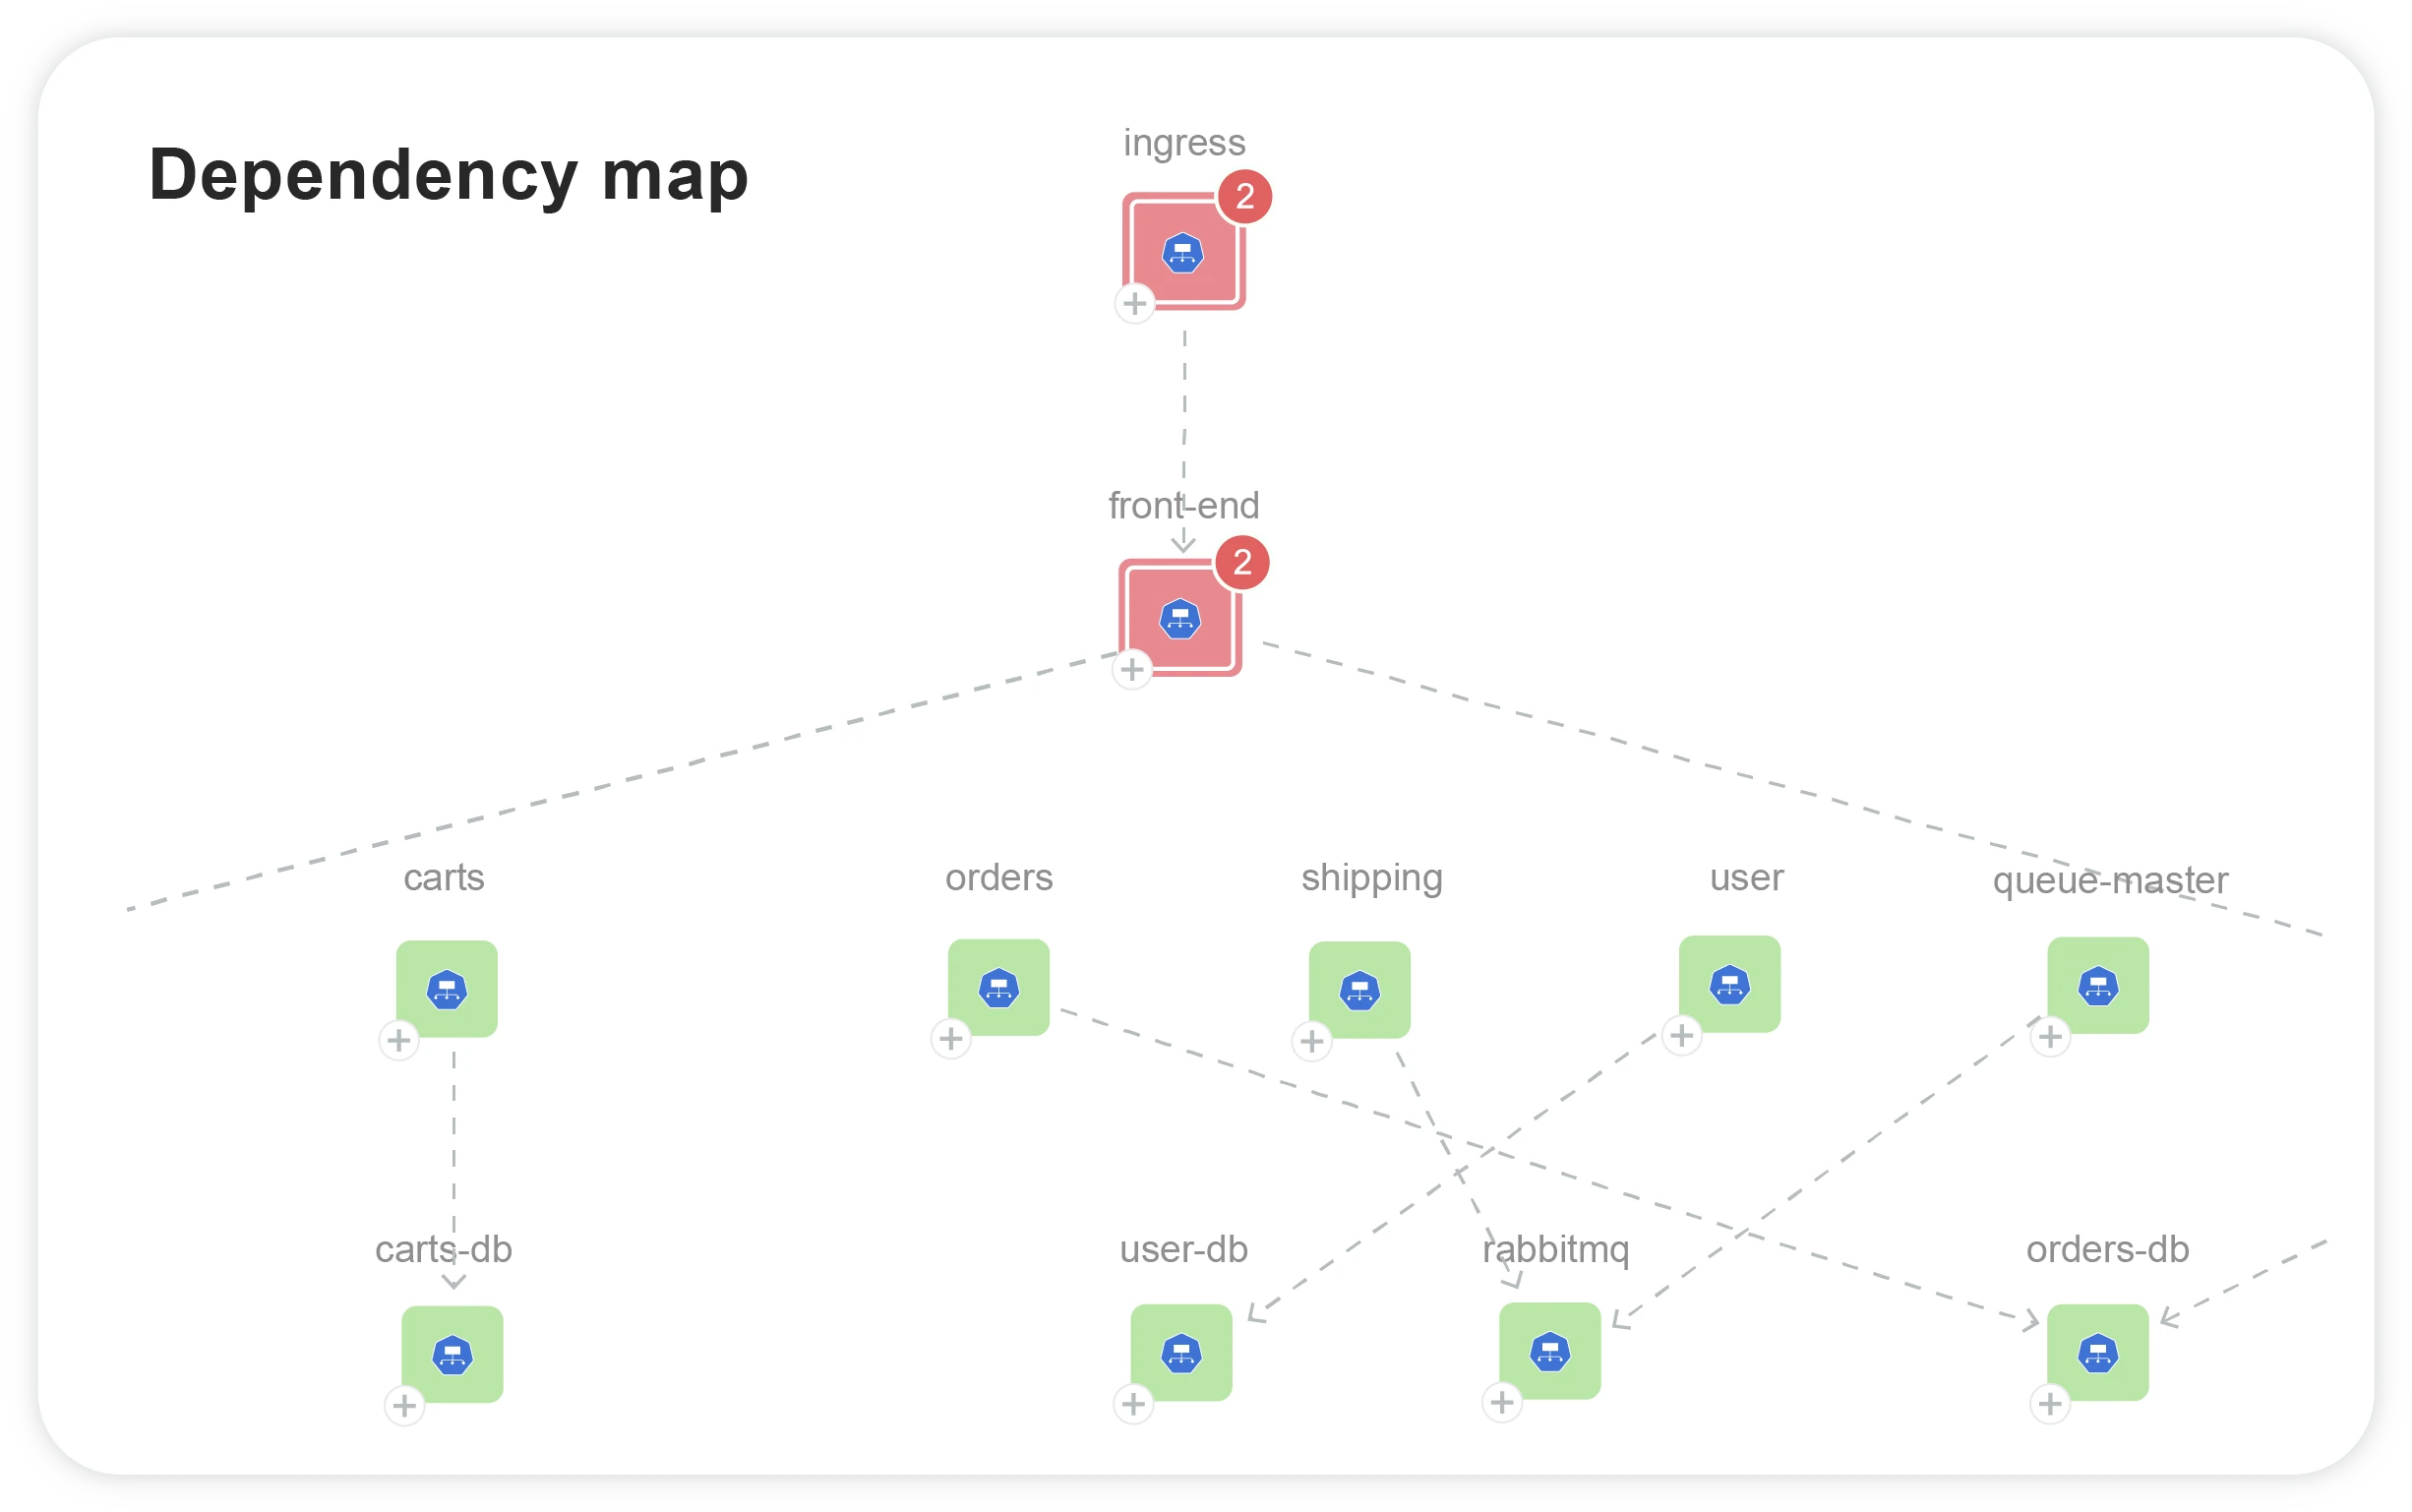
Real-time dependency maps hold the key
Understand every dependency in your IT stack, past and present, mapped for easy navigation.
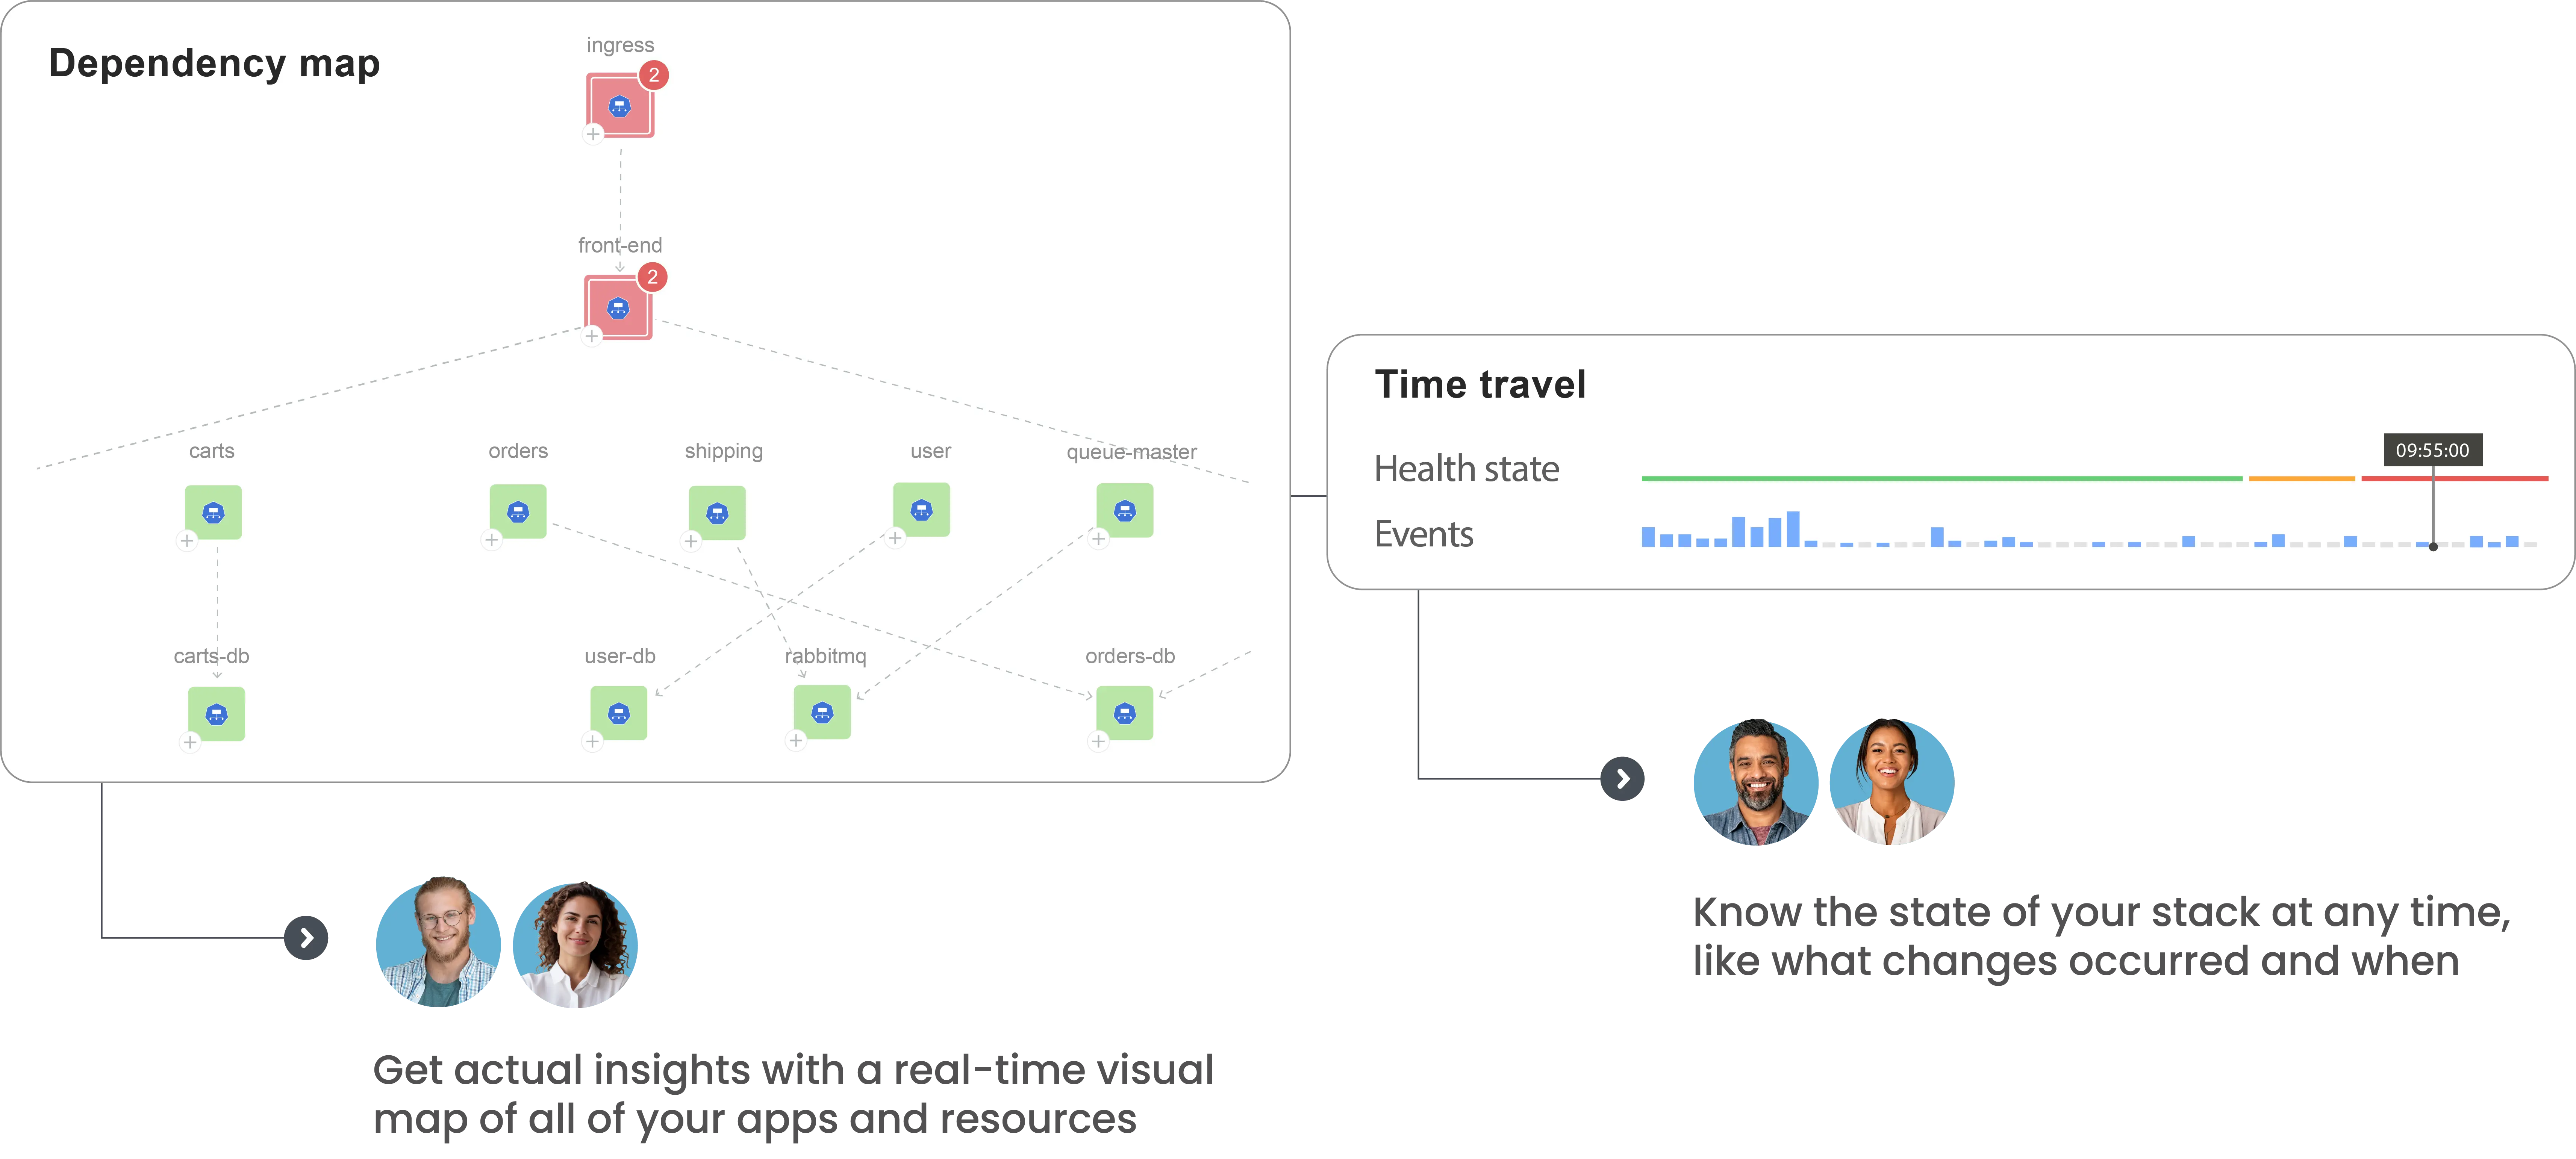
Keep all stakeholders on the same page
Accelerate troubleshooting by correlating all metrics, logs, events, changes, and resources in a single data fabric.
StackState’s observability drives better results and happier users

“The efficiency of simplicity.”
StackState provides a very intuitive interface, with several out-of-the-box integration capabilities, which allow a fast integration cycle providing a set of quick-wins. The easiness of use allows the tool to be used by several teams in the organization, from a 1st line of support until the engineering and architecture teams.

João G TV Engineering Manager
Enterprise (> 1000 emp.)

"Hands-on mentality with an innovative approach for topology-powered observability"
Stackstate has a clear innovative way of "aggregating them all" - i.e. bringing together many different tools (from AWS to Dynatrace to Zabbix) with different data (topology, metrics, tracing) and the time factor.

Gerald B. Senior Product Manager
Mid-Market (51-1000 emp.)
"Great insight into complex application landscapes"
Using the standard StackPack integrations it's very easy to gain insight into your (hybrid) application landscape easily. At the same time, adding custom content is also quite easy to do and will add value quickly.

Dennis L. Solution Architect
Mid-Market (51-1000 emp.)

Open, extensible, and easily integrates with all major cloud platforms and solutions
SOC 2 compliant • Low eBPF overhead • OpenTelemetry-native